CAISO ADS PowerBridge includes an HMI application built with N3uron's Web Vision module. This application allows users to monitor real-time data, visualize and analyze historical trends, and manage alarms easily and efficiently.
For more details, refer to the Web Vision Documentation.
Web Vision Acces
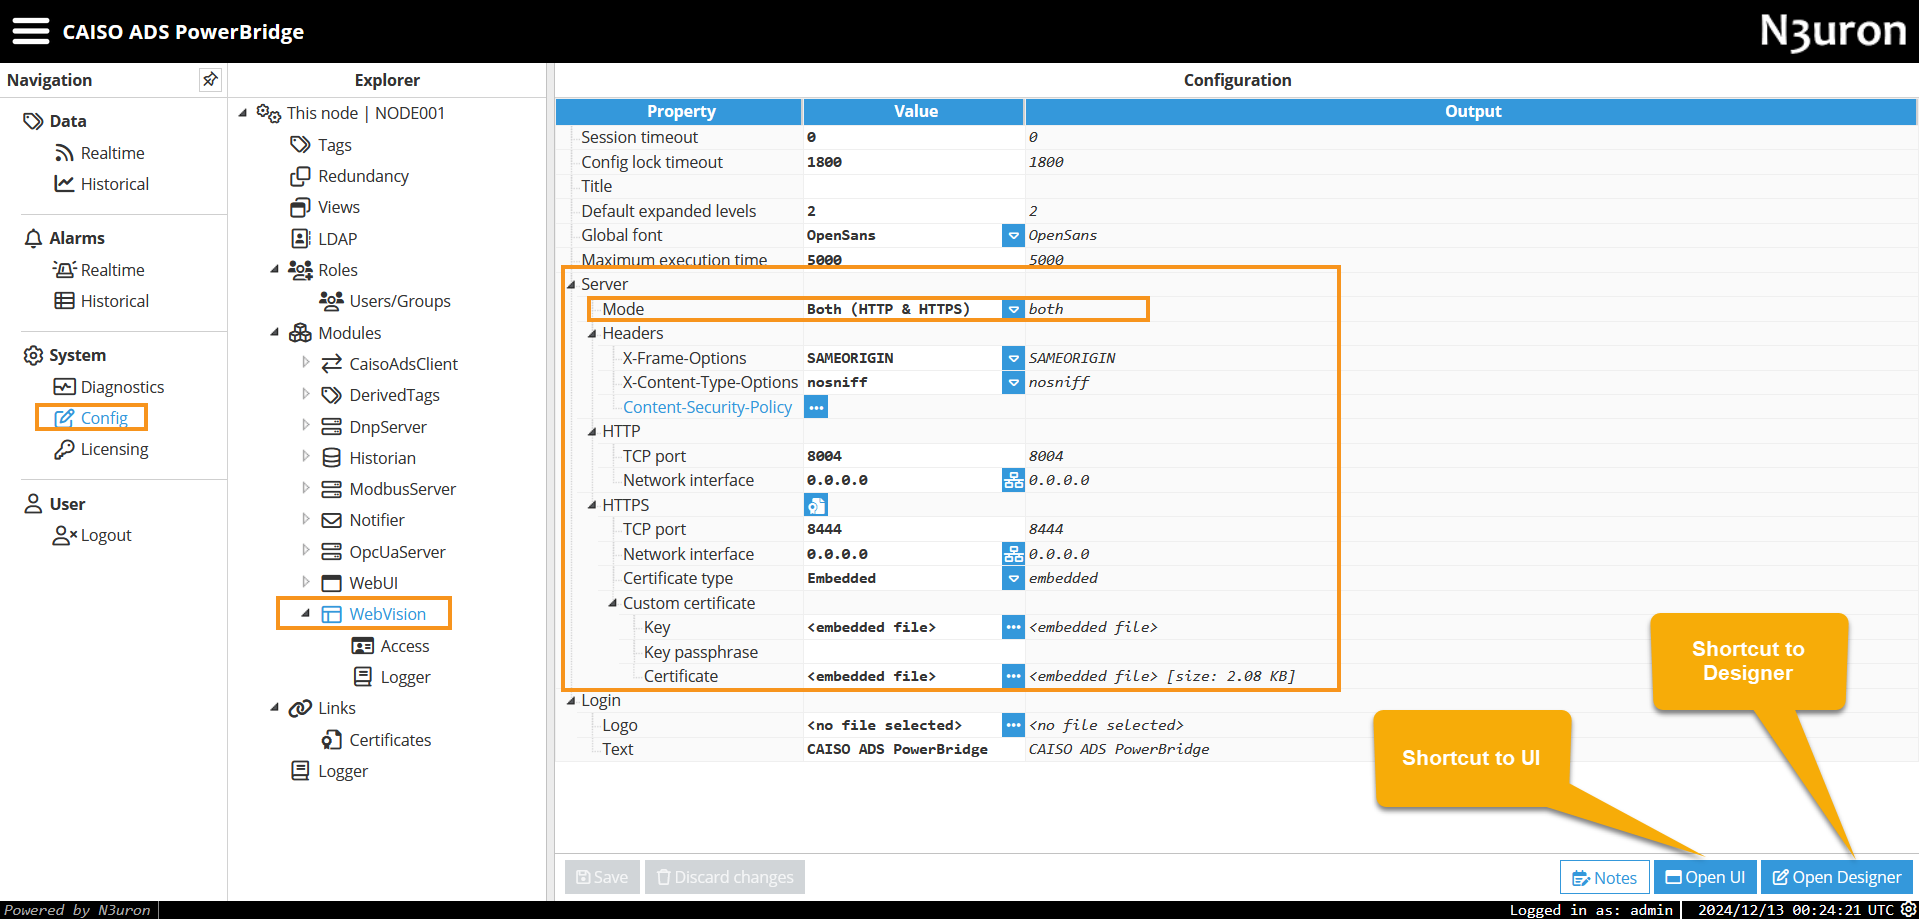
By default, the initial setup supports both HTTP and HTTPS connections through ports 8004 and 8444, respectively.
Note:
For HTTPS communication, you must provide a new certificate or a self-signed certificate. For more details, refer to the Web Vision Initial Configuration section.
User Roles and Permissions
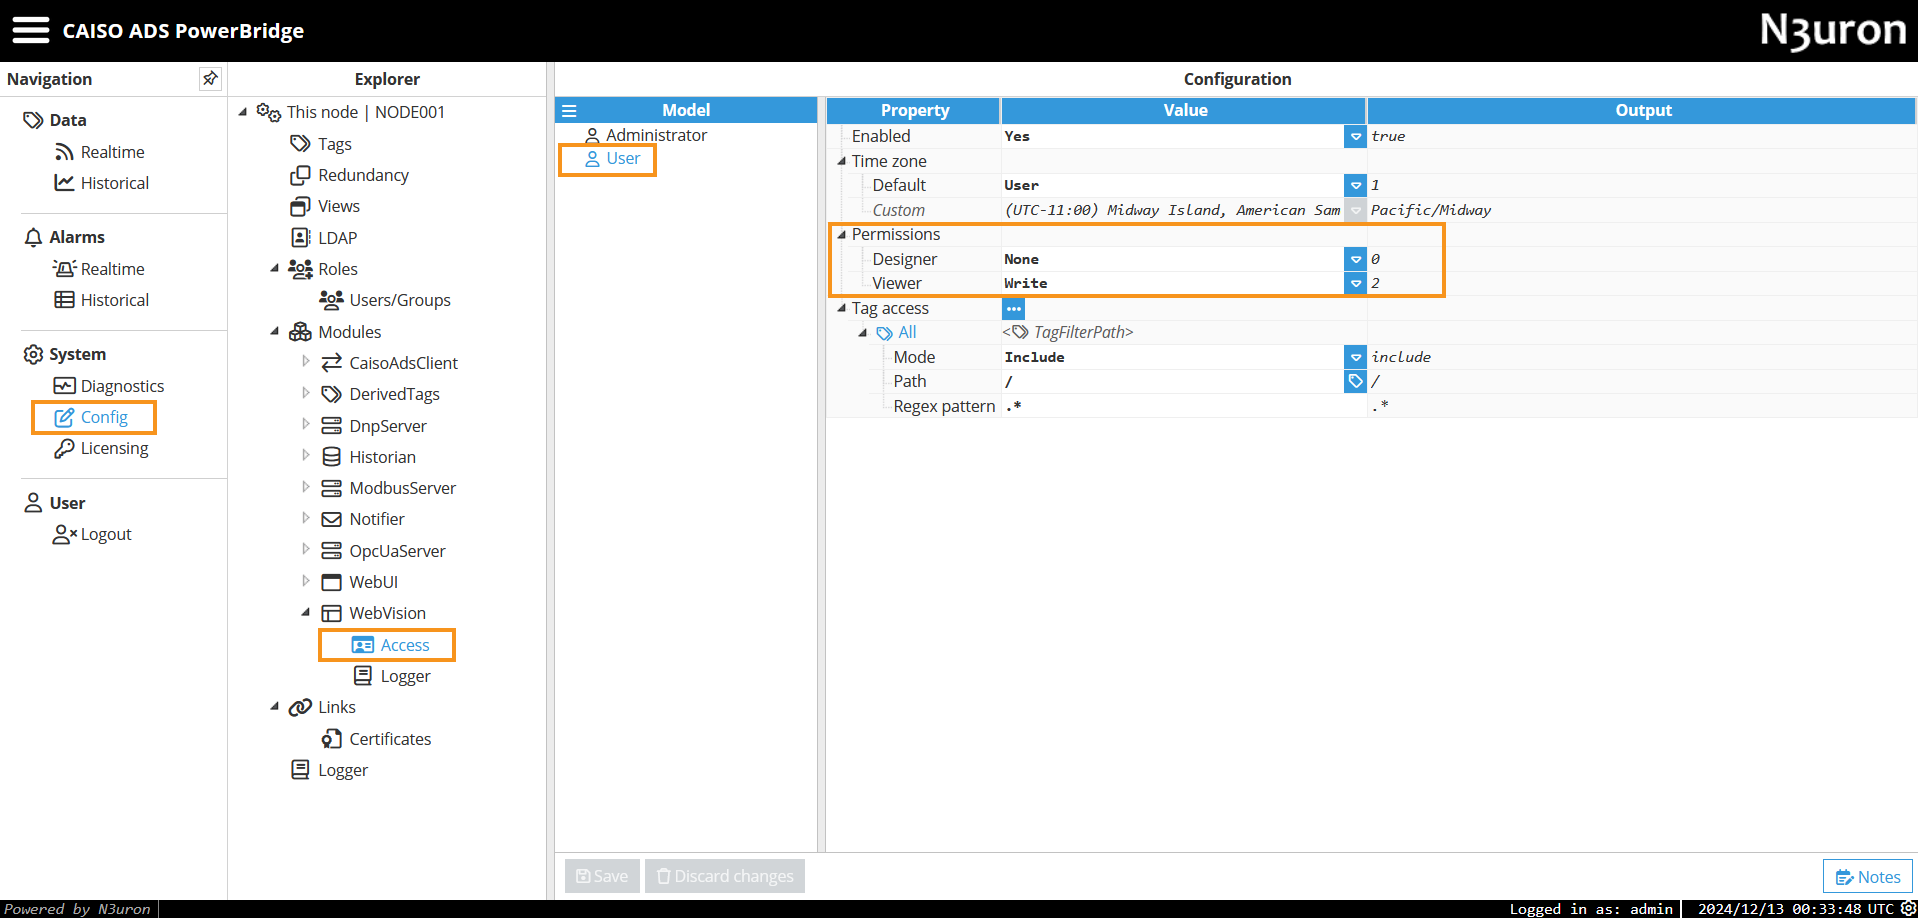
The Web Vision project comes preconfigured with the following role-based permissions:
Administrator Role:
Full editing permissions in the Designer.
Write permissions in the Viewer.
User Role:
Write permissions in the Viewer, allowing interaction with the user interface.
Note:
You can create new roles and users in the Roles section and assign them specific permissions to tailor access according to your operational requirements.

HMI Application Overview
The Web Vision application included in CAISO ADS PowerBridge features the following interfaces and functionalities:
Main window
The Main Window is the central hub for navigating the entire application. From here, users can access all major features and windows of the HMI application.
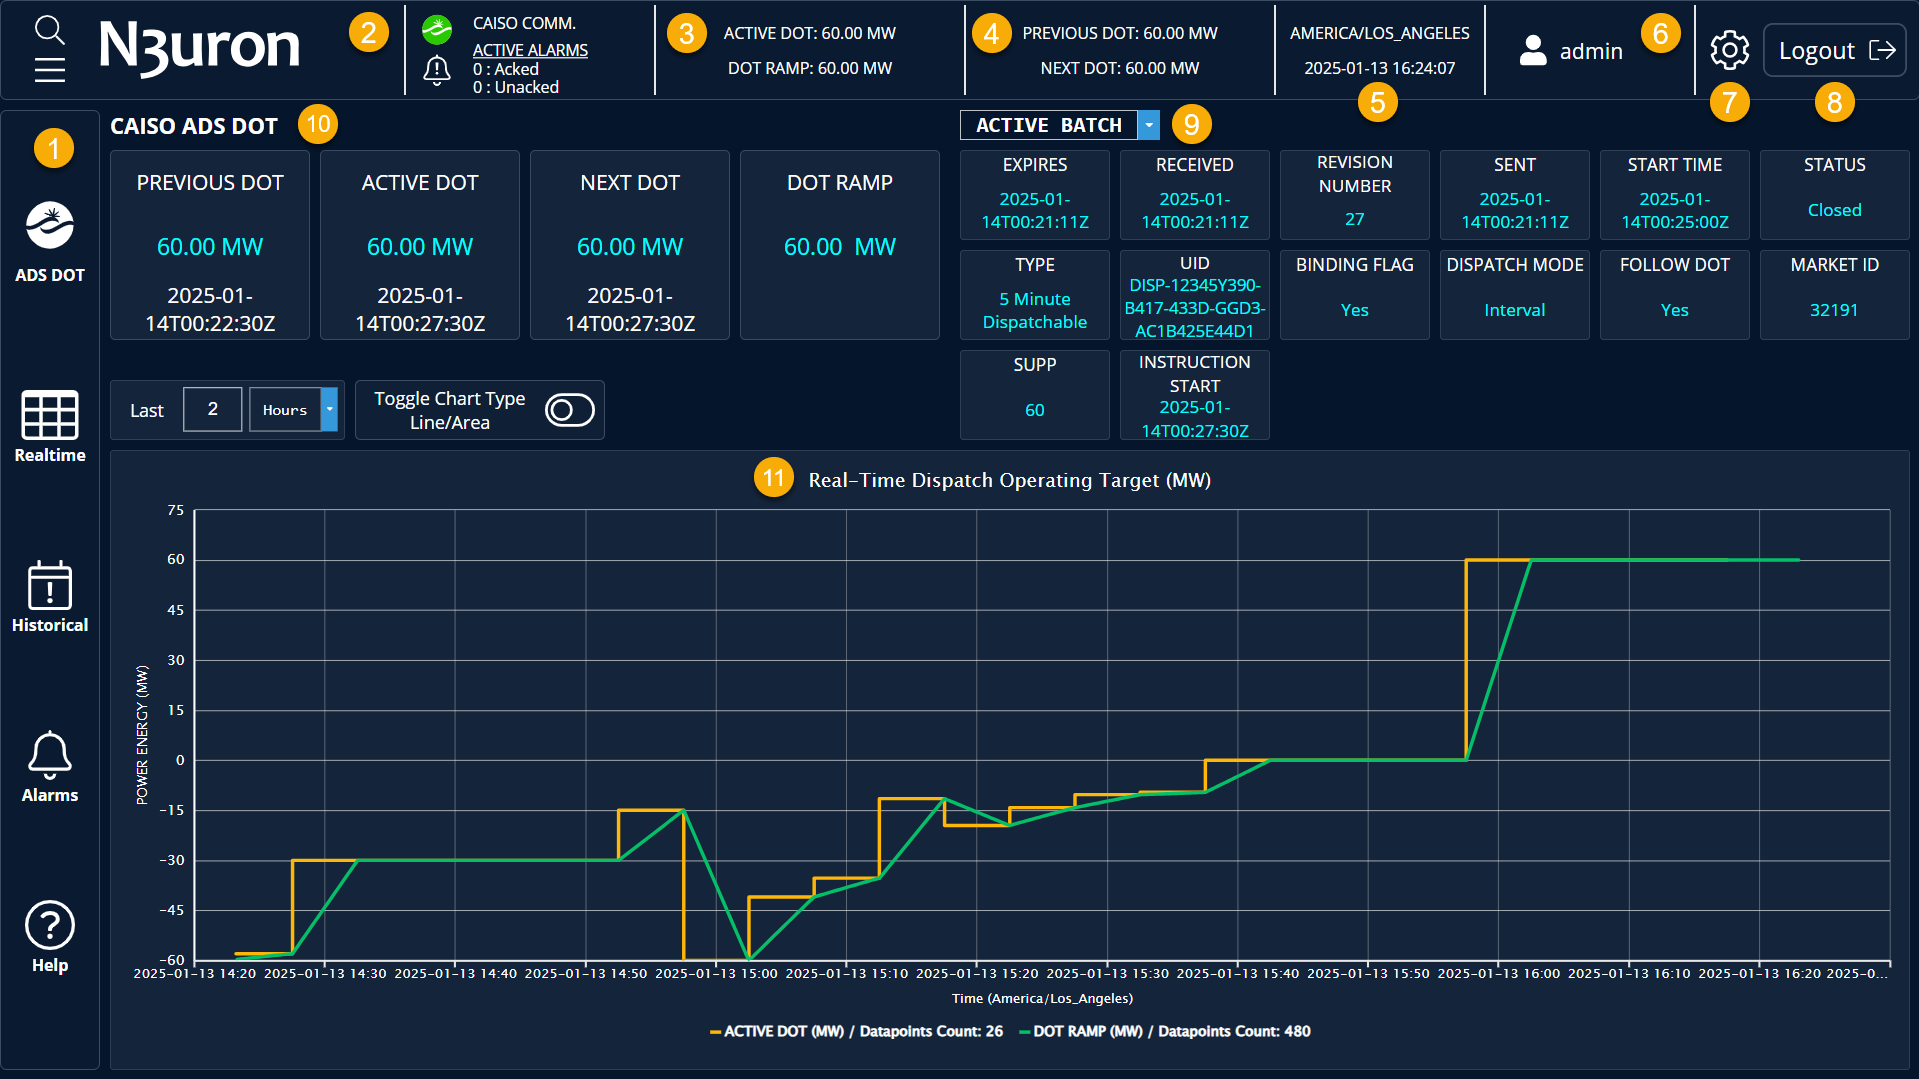
Side-menu:
ADS DOT: Redirects to the main window displaying key CAISO ADS DOT parameters.
Realtime: Opens an interface showing the complete data model with detailed information for each tag.
.gif)
Historical: Launches an HTML5 interface for visualizing, analyzing, and exporting historical data.
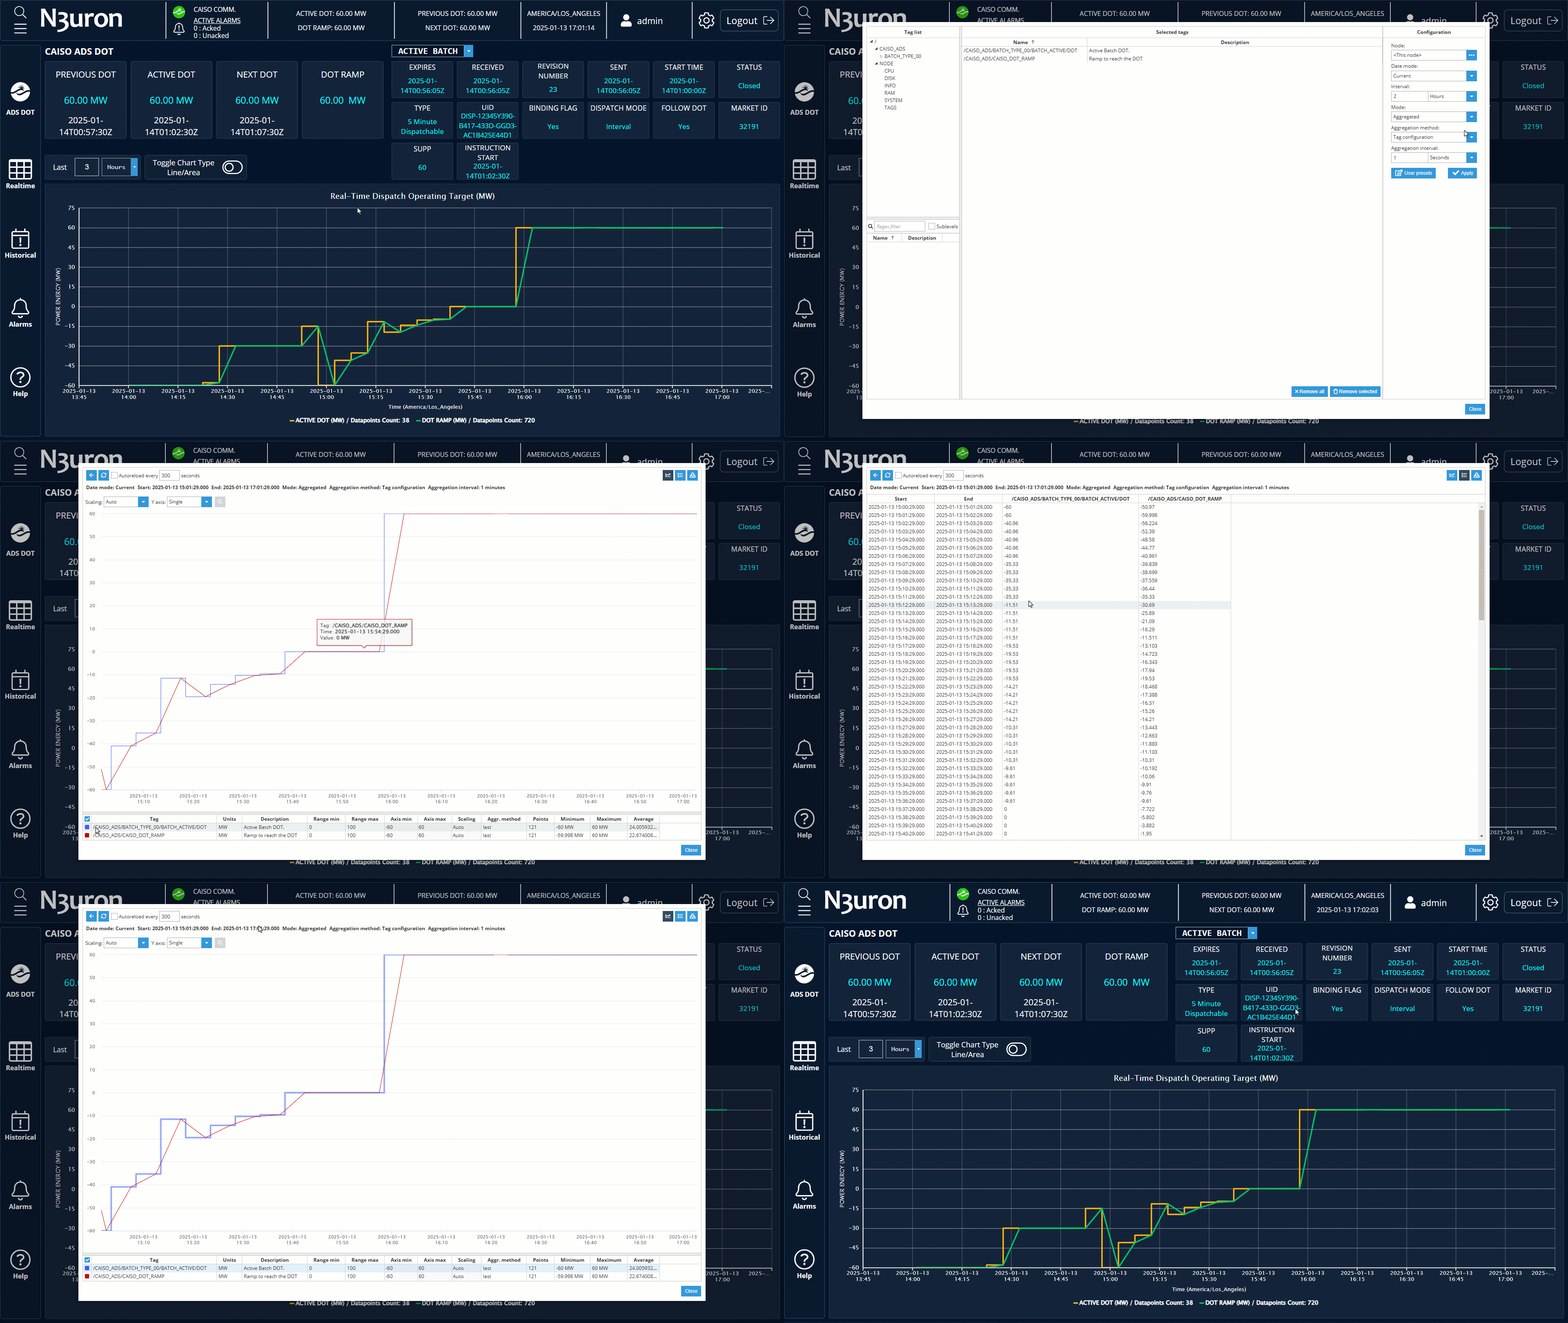
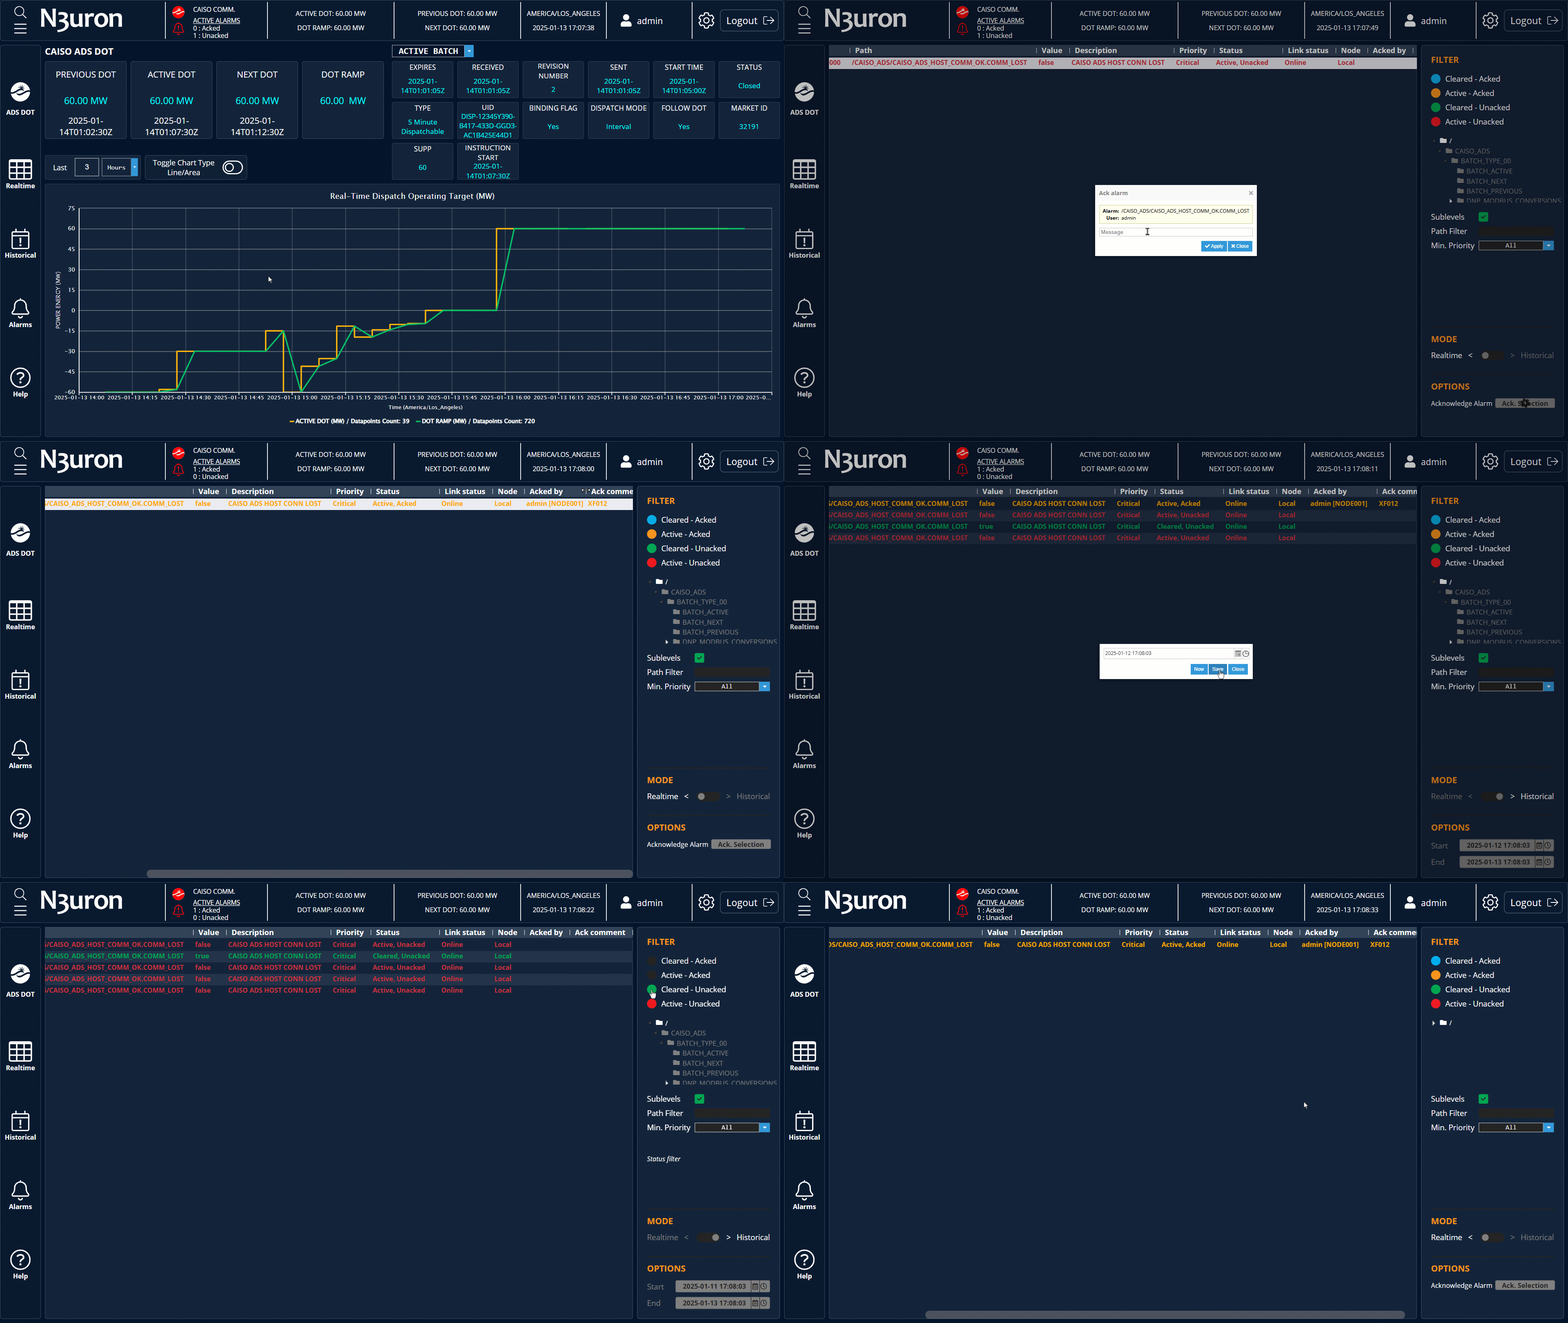
Alarms: Displays a table of real-time and historical alarms, allowing filtering by priority, estate, and path. Users can acknowledge alarms directly from this window.
Help: Redirects to the CAISO ADS PowerBridge documentation.
Communication Status: Displays the communication status with the CAISO ADS Host and any active alarms. Clicking on it redirects to the alarm window for further details.
Active DOT and Ramp: Displays real-time values for the Active DOT and DOT Ramp.
Previous DOT and Next DOT: Shows real-time values for the Previous DOT and Next DOT.
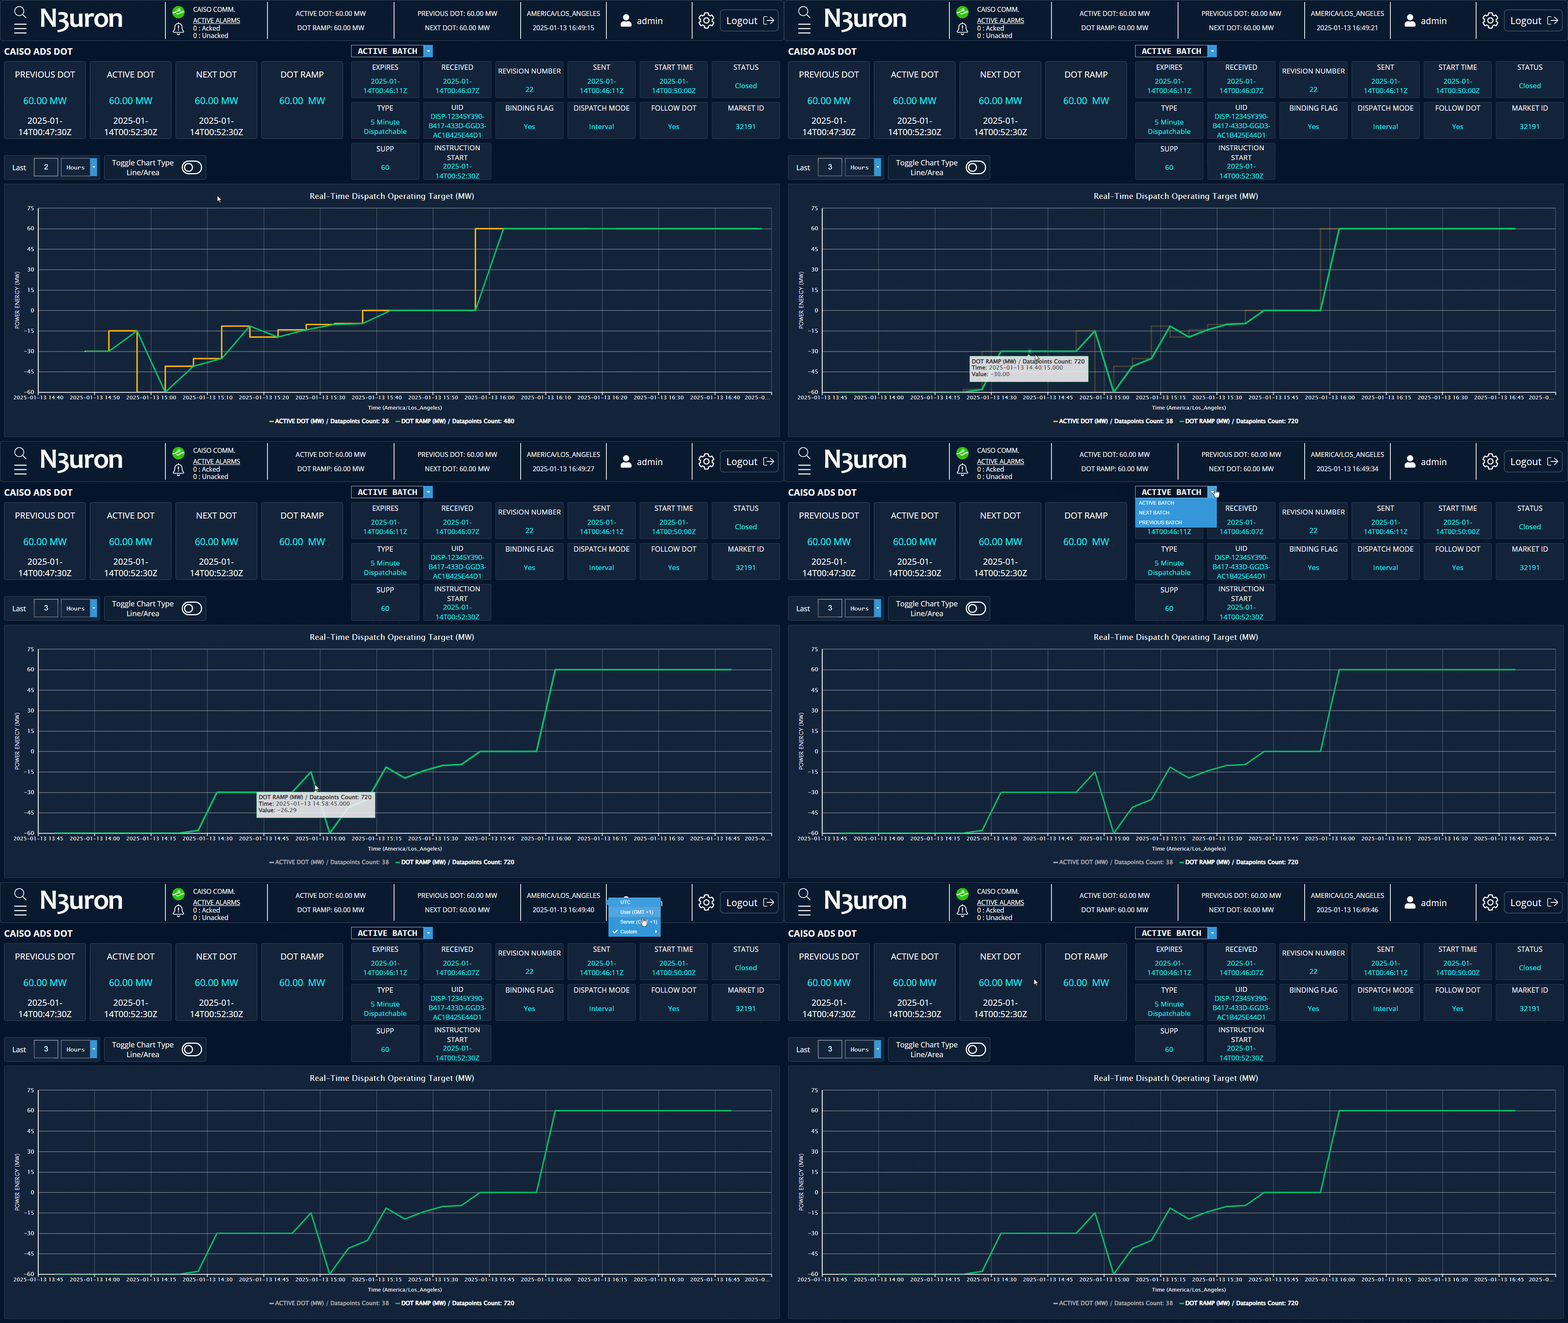
Real-time clock: Displays the current date, time, and timezone. Clicking on it allows timezone adjustments.
User information: Shows the currently logged-in user in Web Vision.
Gear Button (Node Details): Provides access to detailed node information, including CPU usage, RAM utilization, disk usage, and other system metrics.
Logout button: End the user session.
Dropdown Menu: Allows selection of details for BATCH_ACTIVE, BATCH_NEXT, or BATCH_PREVIOUS.
Active DOT Data Section: Displays real-time data for Active DOT, Previous DOT, Next DOT, and DOT Ramp.
Real-time Chart: displays the Active DOT and DOT Ramp values, with options to select different time intervals relative to the current time.