OPC UA Address Space
Once the OPC UA Server module is created, configured and started, the OPC UA Address Space will be populated with data from the current N3uron node. This data includes both tags and diagnostic information. The Address Space can be browsed from any OPC UA client, providing that the OPC UA client authenticates with a user with the relevant permissions.
The UA Expert client, which can be downloaded from https://www.unified-automation.com/, will be used to browse the Address Space in a N3uron node.
Once you are connected to the Server, you can browse the server’s Address Space to locate all the data and information you are interested in. You can do so using the Address Space Browser, which is located on the left-hand side of the application window. Take a look at Examples to see how to connect to the N3uron OPC UA Server using the UA Expert Client.
As defined by the OPC UA Specification, address space always contains three main folders: Objects, Types, and Views, which you can find under the root folder.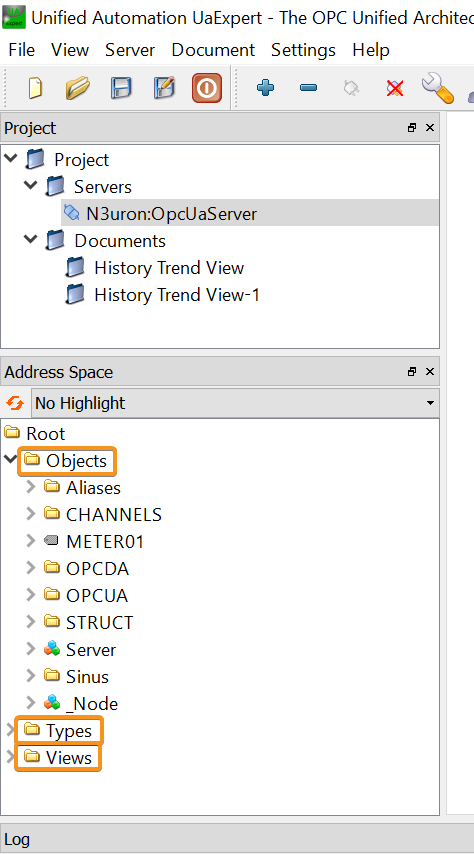
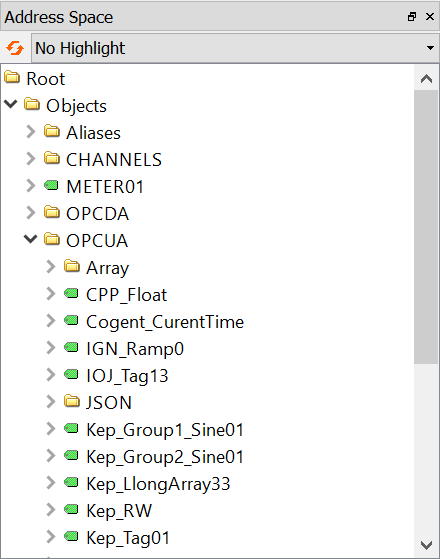
The Objects folder contains all server data including: Aliases, the Data Model (tags and template instances), Server and Node.
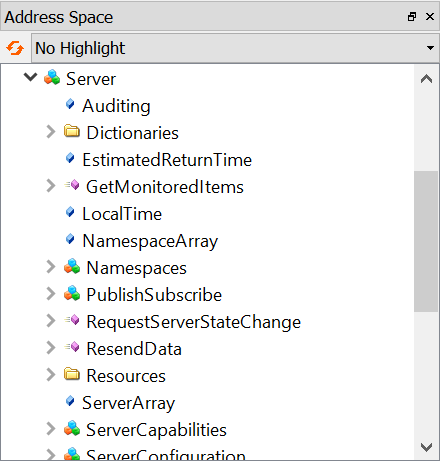
The Server object, which is required as part of the OPC UA standard, neatly organizes large amounts of information about the Server and makes it easily available to any Clients who want to know the capabilities of the Server, its current operational status, and any diagnostic information that the Server can provide.
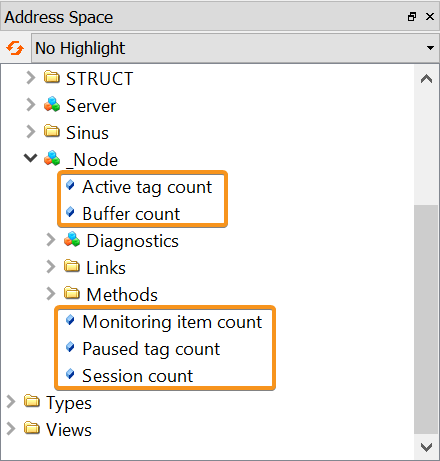
The Node section exposes a lot of information relative to the N3uron node. This section is split into three different subsections: Diagnostics, Links, and Methods.
This section also provides the following five parameters:
- Active tag count: Number of tags with an active subscription in this node.
- Buffer count: Number of events buffered in this node.
- Monitoring item count: Number of monitoring items in this node.
- Paused tag count: Number of paused tags in this node.
- Session count: Number of active sessions in this node.
On the other hand, within Diagnostics, we can find both Modules and Node information folders.
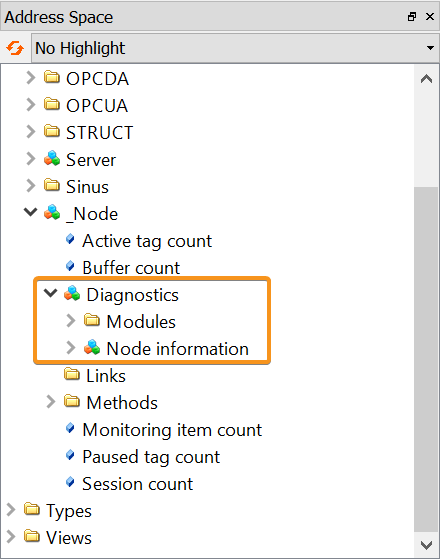
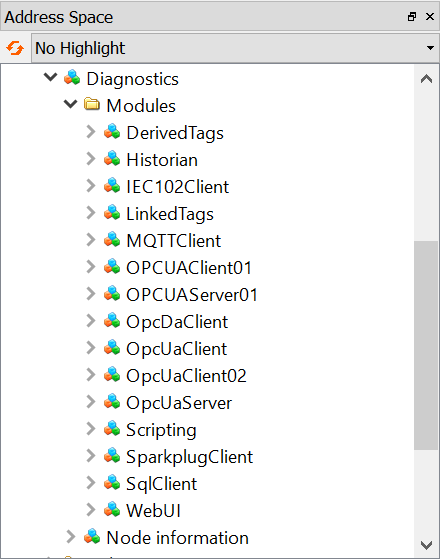
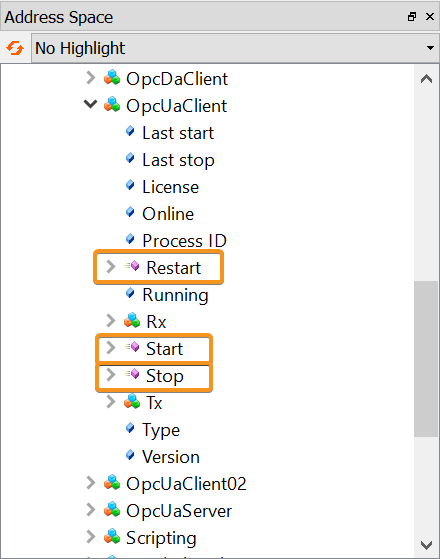
By expanding the Modules section, it is possible to access detailed diagnostic information regarding the status of every module instance created in the node, such as whether it's running or not, the version, license status, etc.
Every module also contains a method, which allows users to start, stop and restart the module.
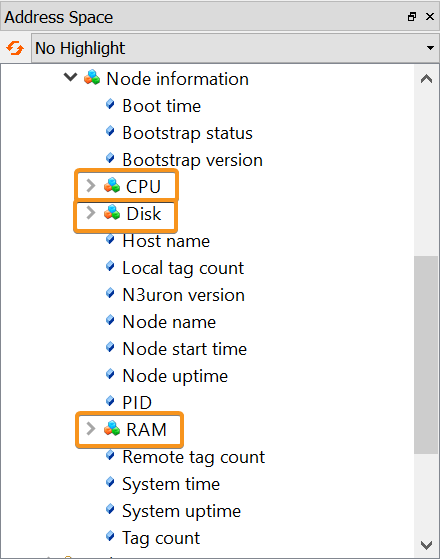
Node information provides some basic metrics about your server, such as the Host name and CPU info. This section makes it possible to access information on the resource usage of the node, enabling you to quickly assess your node's overall health and determine if the node is overloading the server it's running on. You can see the current CPU, memory and disk usage, as well as N3uron and bootstrap versions, how many local and remote tags are available in your node, along with a handful of other information.
On the same level as Diagnostics we can find the Links folder. This section gives you a comprehensive view of all the links configured in the node.
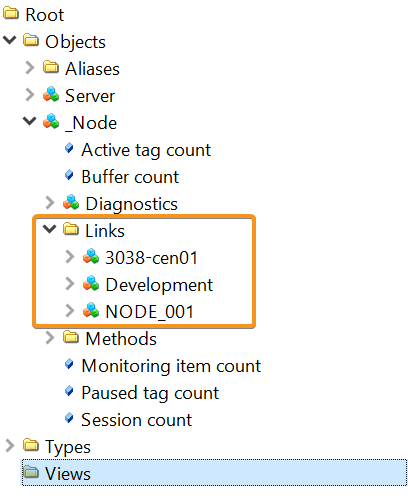
Under Links, we can see as many objects as links exist within the node. Each of these objects has the following information about the given link:
- Type: The connection type, inbound or outbound.
- Online: Indicates whether the link is online or not.
- Active tag count: Number of tags with an active subscription received from this link.
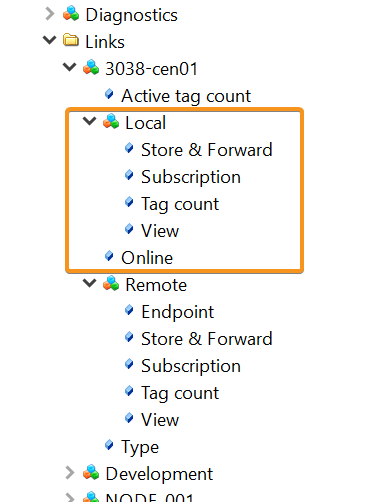
- Local:
- Store & Forward: Indicates whether the storage of events when the remote node goes offline is enabled or not.
- Subscription: This field shows the remote tag groups that this node is subscribed to.
- View: Indicates if the node is publishing the Full Model or alternatively, the data exchanged will be restricted to tags associated with a given view.
- Tag count: Total amount of tags published from the local node through the link.
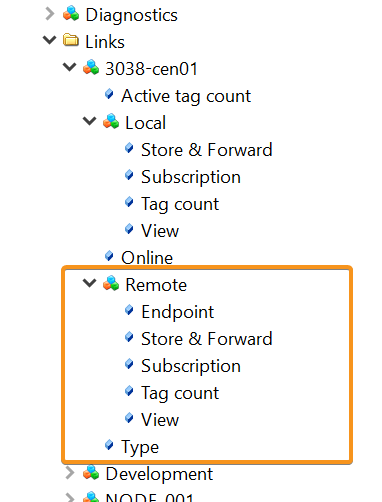
- Remote:
- Endpoint: Host or IP address of the remote node.
- Store & Forward: Indicates whether the remote node will store events whenever the connection goes offline or not.
- Subscription: This field shows the local tag groups the remote node is subscribed to.
- View: Indicates if the remote node is publishing the Full Model or alternatively, the data exchanged is restricted to tags associated with a given view.
- Tag count: Total amount of tags published from the remote node through the link.
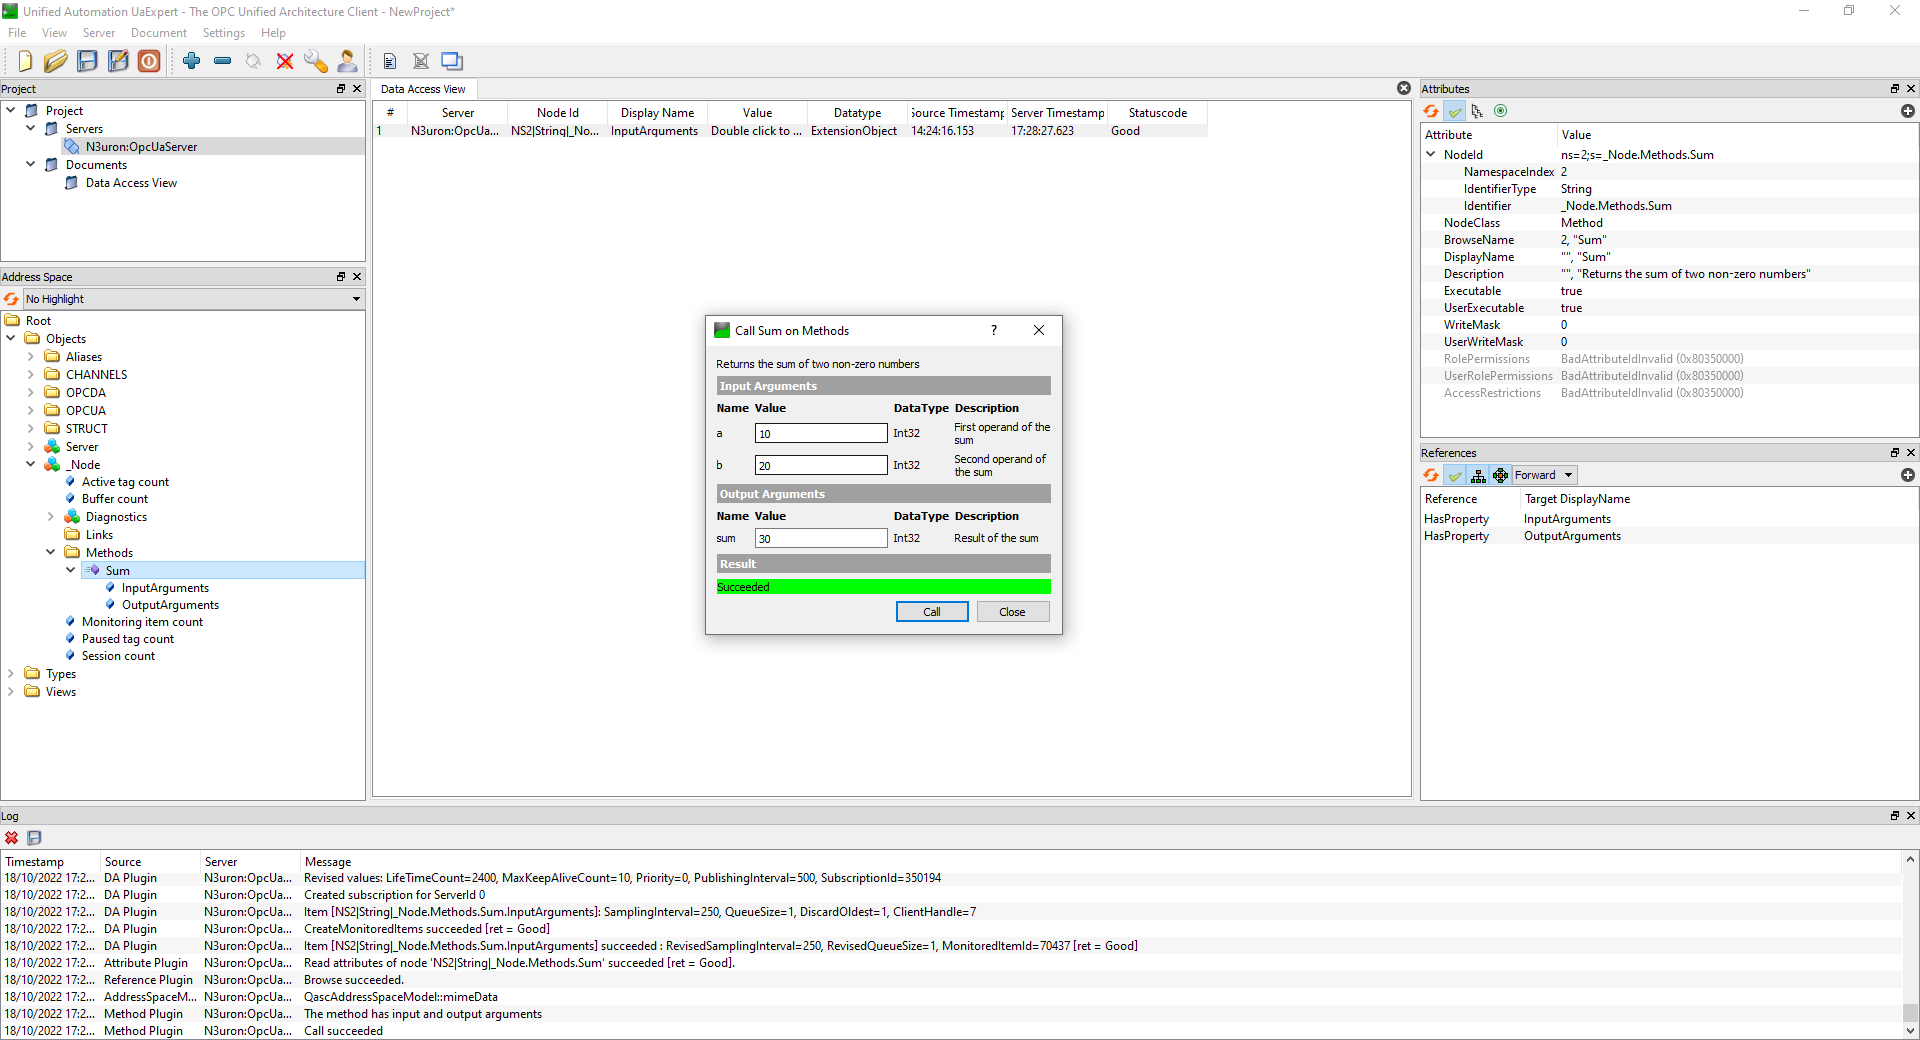
Finally, within _Node, users can also call Methods that have been previously defined in the OPC UA Server module instance. For more information about Methods, go to Configuration and Examples.
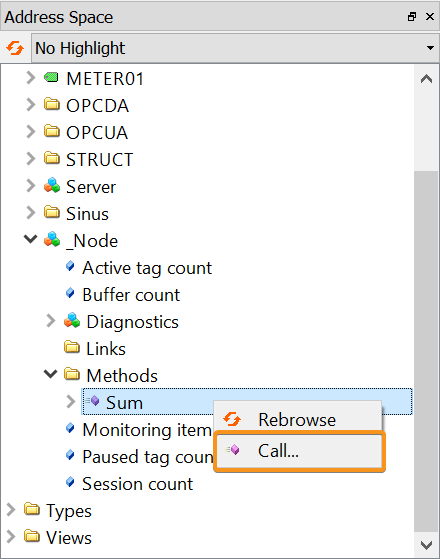
In the dialog box, you can set input values and then press Call to execute the method on the server. If the call succeeds, you might see the return values.