The following steps show how to access data coming from an OPC XML server using N3uron's OPC XML Client module.
- Step 1: Create a module instance (Config => Modules => Model=> New module)
.png) Figure 4. Create a new module
Figure 4. Create a new module
- Step 2: Provide a name for the module (in this case OpcXmlClient), assign the module type (in this case OpcXmlClient), and save the new configuration settings.
.png) Figure 5. Configure the module
Figure 5. Configure the module
- Step 3: Configure the Logger and API sections (the default values are usually sufficient). Save these settings.
- Step 4: Create a new client (Config => Modules => OpcXmlClient => Model => New client).
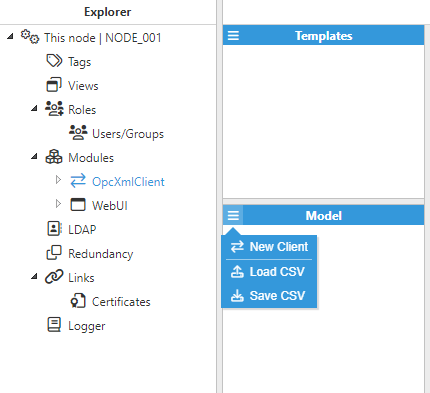 Figure 6. Create a new client
- Step 5: Provide a name for the client (in this case OpcXmlClient01) and configure as appropriate. For this example. the following settings have been used:
- Connection
- Host: 10.101.3.210
- Port: 80
- Authentication
- Username: user
- Password: n3uron
- Connection
The rest of the parameters have been left as their default values.
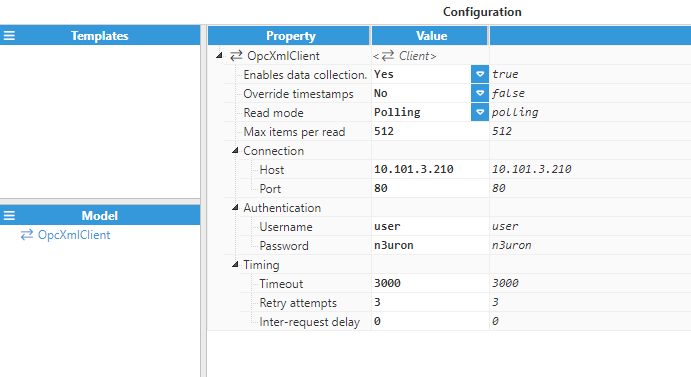 Figure 7. Configure the client
- Step 6: Create a new tag (Config => Tags => Model=> New tag)
.png) Figure 8. Create a new tag
Figure 8. Create a new tag
- Step 7: Provide a name for the tag (in this case Tag) and configure it as appropriate. All details regarding communication should be configured in the Source entry.
- Source:
- Enabled: Yes
- Module Type: OpcXmlClient
- Module Name: OpcXmlClient
- Config:
- Client: OpcXmlClient01
- Address: Random.Item1
- Array: No
- Index: 0
- OPC scan rate: 5000
.png) Figure 9. Tag configuration
Figure 9. Tag configuration
- Step 8: The tag should now be available and displaying as good quality in the Real-Time display.
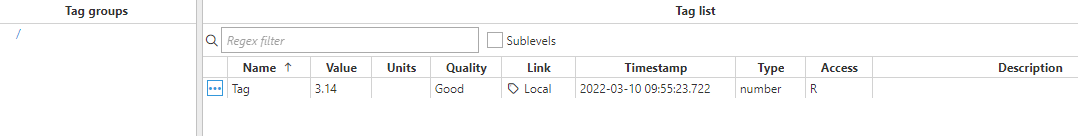 Figure 10. Values displayed in Real-Time
Note:
Log files for troubleshooting can be downloaded from the WebUI at Diagnostics => This node => Export logs button