N3uron simplifies the process of generating robust data models that make up a single source of truth. This means that every update at the node is automatically shareable with all other applications throughout the Enterprise, reducing the potential for discrepancies and data siloing.
Tags are created in the WebUI's interface, where users can create tags manually, import a csv file containing one or more tags, or create a new template instance. It's also possible to create folders that help improve the organization of tag hierarchies in the model.
Tags can be created manually in the Model panel. Users can create a single tag, a group, or a template instance.
To create tags, all main properties must be configured:
- Data format
- Scaling
- Views
- Data Source
- Alarms
- History
The following steps will explain in detail how to create a tag and configure each available option in N3uron.
- Step 1: Go to System-->Config-->Tags. From here, you can create a new tag in one of two ways: click on the menu button located on the left-hand side of the Model header and select New Tag, or alternatively right-click on the root folder in the Model panel and select New Tag. Either way will display a menu with the following options:
- New Group: Allows a new folder or a template instance to be created.
- New Tag: Allows a single tag to be created. Select this option.
.png)
- Step 2: Provide a name for the tag (in this example, Tag).
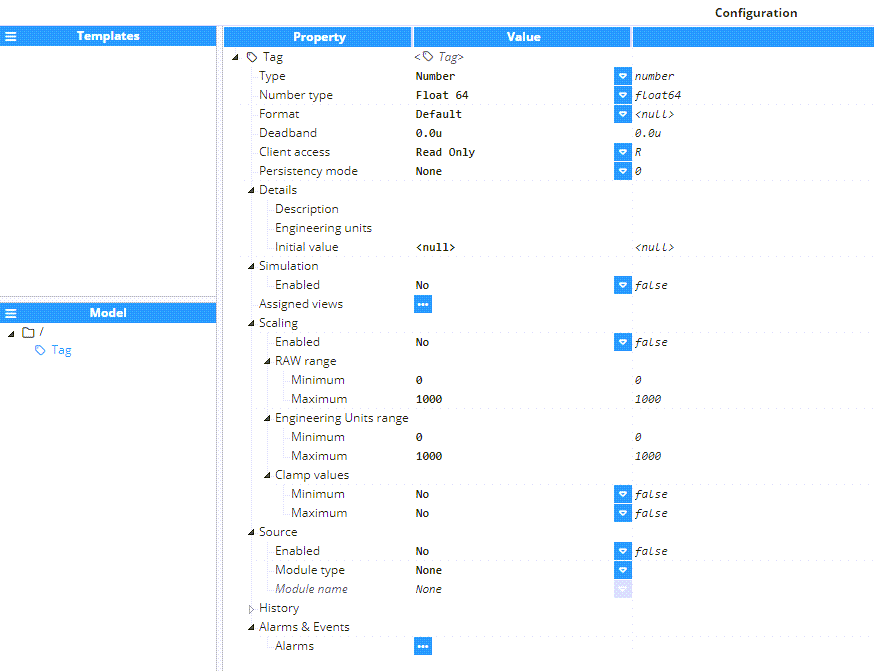
- Step 3: Now, we will go over all the different properties that can be configured for Tags.
Main Parameters
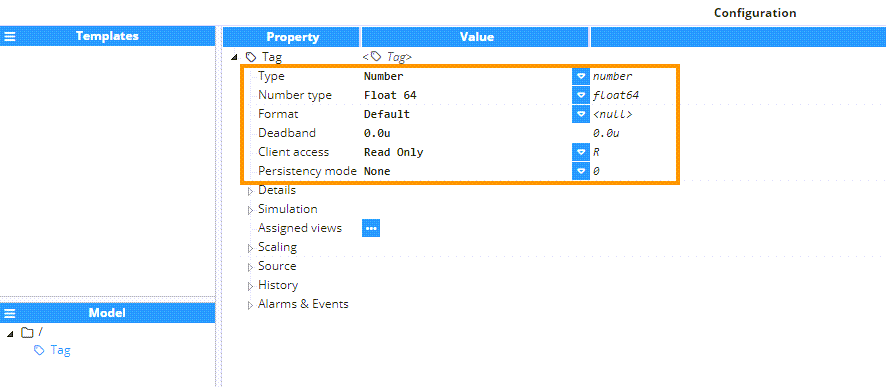
- Type: Configure the tag data type by clicking on the drop-down and selecting any of the following available options:
- Number
- String
- Boolean
- Number type: When the tag type is set to Number, you can choose from various numerical data types. By default, the Number type is set to Float 64. Note:This feature is available from N3uron version 1.21.11.
.png)
- Format: Select the format that will be applied to the tag in WebUI:
- Default
- Integer
- Decimal Precision 1
- Decimal Precision 2
- Decimal Precision 3
- String
- Expression / Custom Value
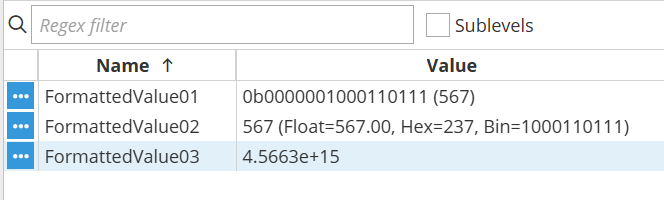
The % symbol indicates the start of a placeholder (it is always required), and 1$ refers to the first argument, which in this case is the value of the tag. If you have multiple placeholders, the first 1$ can be omitted, but all subsequent placeholders must include the corresponding 1$ notation.
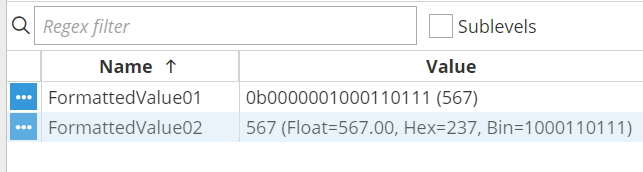
Here are some examples:
For 'Custom value' 0b%1$016b (%1$d) Or 'Expression' ="0b%1$016b (%1$d)" .png)
For 'Custom value' %d (Float=%1$.2f, Hex=%1$X, Bin=%1$b) Or 'Expression' ="%d (Float=%1$.2f, Hex=%1$X, Bin=%1$b)"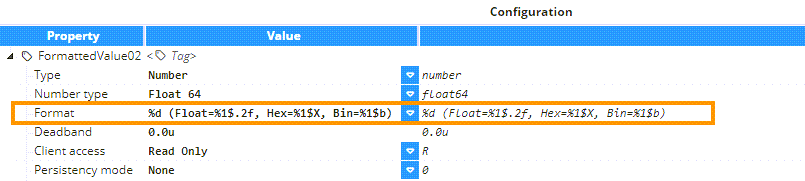
For 'Custom value' %.4e Or 'Expression' ="%.4e ", to display the tag in scientific notation with 4 decimal places..png)
- Deadband: A numerical value used to prevent unnecessary updates for Tags whose values change by small amounts. The suffix -u is used for absolute change in engineering units (e.g. 0.1u) whereas the suffix -% indicates percentage values (e.g. 1%).Client access: Defines whether a Tag is read-only or writable. Available options are as follows:eadead & Write
- Persistency mode: This parameter specifies the behavior whenever the source module, the whole service, or the system is restarted. Valid values are as follows:
- None: Whenever the source module goes offline or at startup, the tag will take its default value and its quality will be equal to Bad-Uninitialized.
- Memory: The tag value and quality are maintained when its source module goes offline. However, in the event of a system restart, it will behave the same as with None.
- Disk: The tag's quality and value will be stored in the disk and will persist even in the event of a system restart.
Details
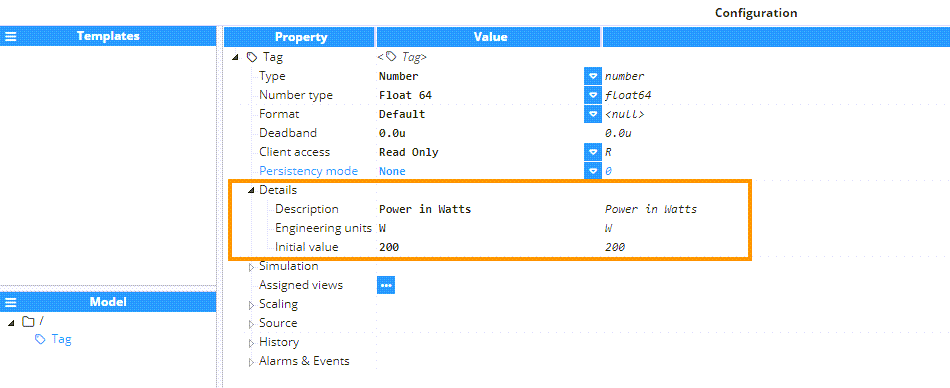
- Details: This section includes some metadata information related to the tag.
- Description: Provides extra information about the tag.
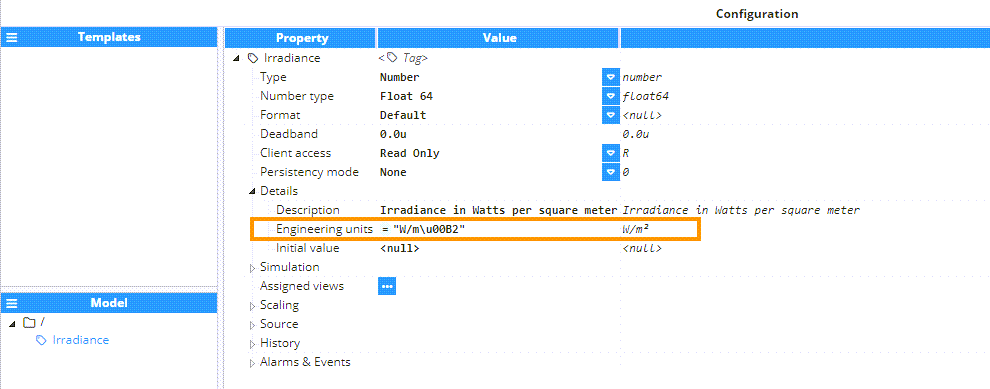
- Engineering units: The tag engineering units. if superscripts or subscripts are required, you can use an expression to include them:
- Superscripts:
- ="\u00B1" >> ±X
- ="\u00B2" >> X²
- ="\u00B3" >> X³
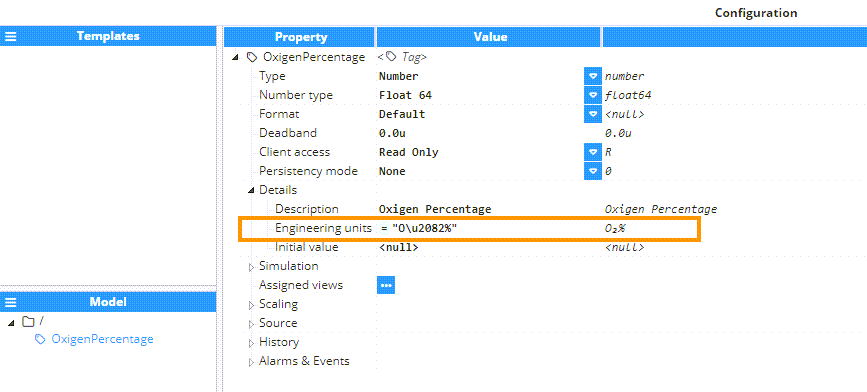
- Subscripts:
- ="X\u2082" >> X₂
- ="X\u2083" >> X₃
- ="X\u2084" >> X₄
- Superscripts:
- Default Value: Sets the default value that the tag will take after a system and/or module restart, in case it has not been configured with disk persistency.
Simulation
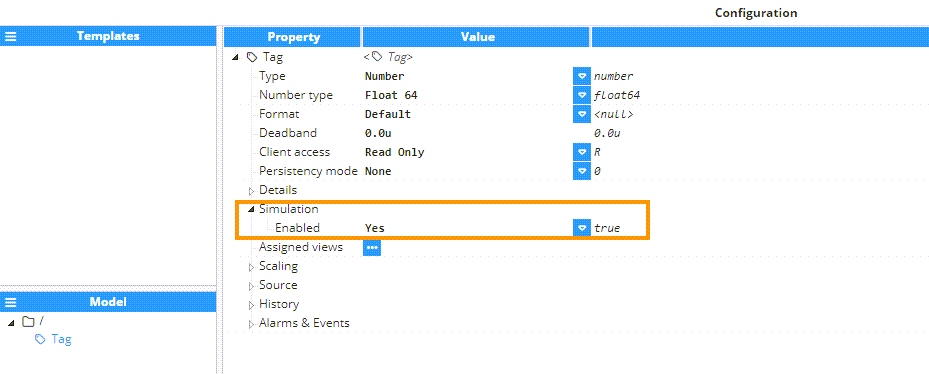
- Simulation
- Enabled: Enables or disables tag simulation. When Enabled, tag values are simulated instead of being provided by a source module. The simulated value corresponds to the time elapsed since midnight in milliseconds. When the tag type is set to Number, its value increases by the specified rate of change; for example, selecting a 5-second (5000ms) interval will add 5 to the value every 5 seconds. If the tag type is String, the tag updates to the current timestamp at each interval, reflecting the latest time every 5 seconds. For a Boolean tag type, the value toggles between False and True at each rate of change, switching every 5 seconds during the simulation. Configuration of the rate of change for simulated values is done in the node configuration. By default the Rate of change of the simulation is 5000ms.
.png)
- Enabled: Enables or disables tag simulation. When Enabled, tag values are simulated instead of being provided by a source module. The simulated value corresponds to the time elapsed since midnight in milliseconds. When the tag type is set to Number, its value increases by the specified rate of change; for example, selecting a 5-second (5000ms) interval will add 5 to the value every 5 seconds. If the tag type is String, the tag updates to the current timestamp at each interval, reflecting the latest time every 5 seconds. For a Boolean tag type, the value toggles between False and True at each rate of change, switching every 5 seconds during the simulation. Configuration of the rate of change for simulated values is done in the node configuration. By default the Rate of change of the simulation is 5000ms.
Assigned Views
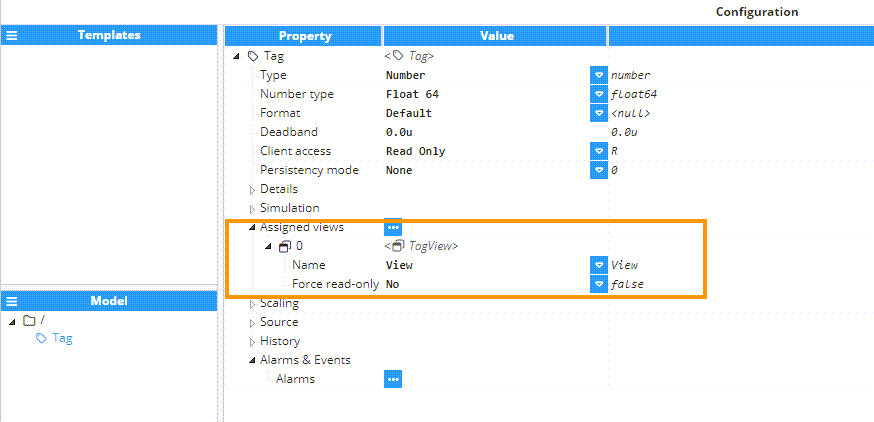
- Assigned Views: This section allows users to assign the tag to one or more Views. Views are used to restrict the information shared with other nodes through Link connections.
- Name: Clicking on the drop-down menu button displays the available views, which need to have been previously created in the corresponding section of the Explorer panel.
- Force Read-only: Regardless of whether the tag has been defined as writeable in the Client access section, tag access can be restricted to read-only through all views by enabling this setting.
Scaling
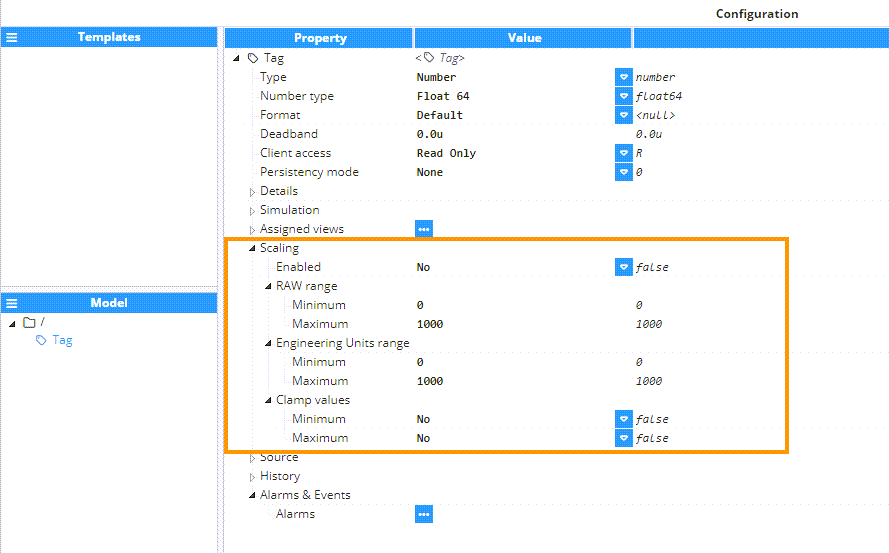
- Scaling: This section defines how the tag value will be scaled from its source to the reported value using linear scaling, while also specifying the parameters for setting clamp values if necessary.
- Enabled: Enables or disables the linear scaling of the tag.
- Raw Range
- Minimum: Defines the lower limit of the raw value range.
- Maximum: Defines the upper limit of the raw value range.
- Engineering Units Range
- Minimum: Defines the starting point of the scaled value range.
- Maximum: Defines the end point of the scaled value range.
- Clamp Values
- Minimum: If enabled, the values that fall below the start of the scaled value range will be adjusted to that value.
- Maximum: If enabled, the values that fall above the end of the scaled value range will be adjusted to that value.
Below is an example of scaling a temperature analog sensor from 0 to 100ºC, with a raw value ranging from 0 to 32,767. The linear equation is:
ScaledValue = ΔS * (RawValue - RM) / ΔR + SM, where:
ΔS = (Engineering Range Maximum - Engineering Range Minimum).
ΔR = (RAW Range Maximum - RAW Range Minimum).
RM = RAW Range Minimum.
SM = Engineering Range Minimum.
For instance, if the raw value from the temperature sensor reading is 16,383.5, which represents half of the raw value range, the scaled value can be calculated as follows:
ScaledValue = ((100 - 0) * (16383.5 - 0)) / ((32767 - 0) + 0;
ScaledValue = 50ºC
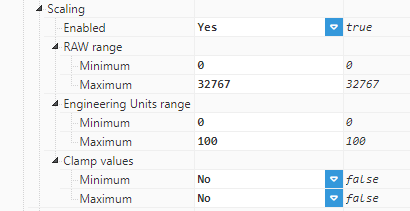 Hence, the reported value of the tag after the scaling process will be 50.
Source
.png)
- Source: Specifies how the tag determines its value.
- Enabled: When set to No, the tag will behave like a memory tag. On the contrary, when Enabled, the source module will provide the tag's value, quality and timestamp.
- Module Type: Defines the type of the module used to obtain the tag's value, quality, and timestamp. If the desired module type were not available on the list displayed in the drop-down menu, it would mean that such functionality is not installed yet.
- Module Name: Enter the name of the module instance that should have been previously created.
History
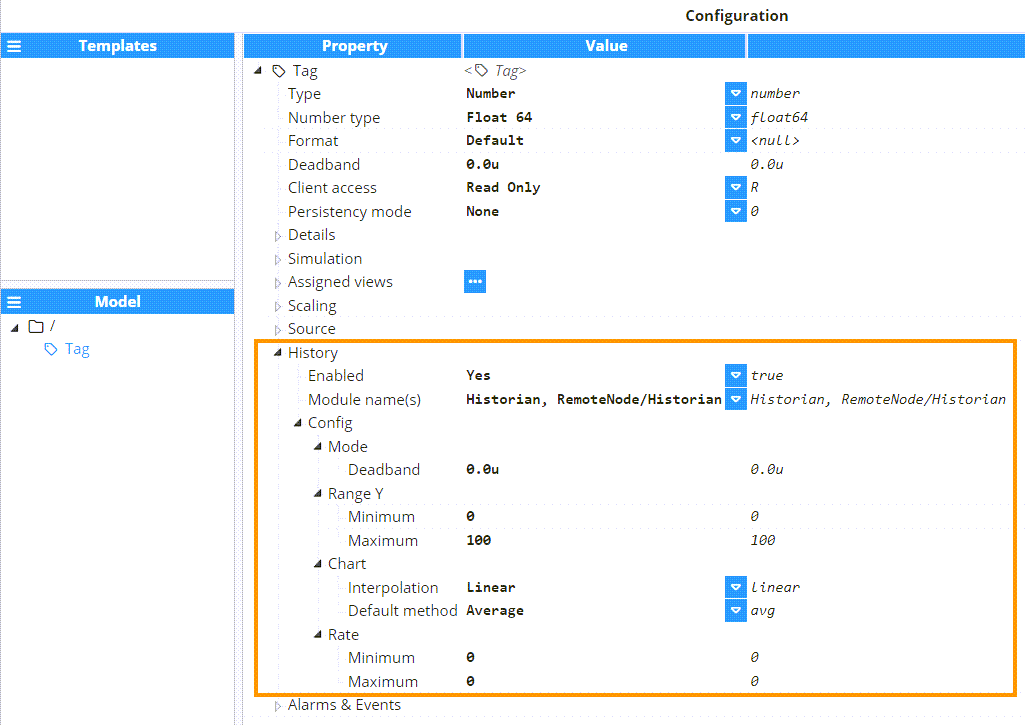
- History:
- Enabled: Determines whether the Tag will report its history to the Tags Historian system.
- Module name: Specifies the name of the historian module or modules, either local or remote, that will record the data. A comma-separated list of instances used must be entered. If a remote Historian instance is being used, the following pattern must be used NodeName/HistorianModule.
- Config:
- Mode:
- Mode:
- Change: Collects a record whenever the tag value changes. Only values that surpass the deadband will be stored.
- Deadband: The suffix -u is used for absolute change in engineering units (e.g. 0.1u) whereas the suffix -% indicates percentage values (e.g. 1%) over the current tag value.
- Mode:
- Range Y: Configuration of the by-default values for the Y-axis limits in the chart.
- Minimum: Default Y-axis minimum value in engineering units.
- Maximum: Default Y-axis maximum value in engineering units.
- Chart: This allows you to configure the graph to be generated during the data history.
- Interpolation: Defines the interpolation mode to be used to display the data in the chart. There are 2 available options:
- Step: Value changes will be shown as discrete steps.
- Linear: Value changes will be shown as a line.
- Default method: Specifies the default aggregation method used for the tag in the chart. Available options are:
- Average: Returns the weighted time average during the aggregation period.
- Minimum: Returns the minimum value in the aggregation period.
- Maximum: Returns the maximum value in the aggregation period.
- First: Returns the first value in the aggregation period.
- Last: Returns the last value in the aggregation period.
- Delta: Returns the difference between the first and last sample during the aggregation period.
- Standard deviation: Returns the Standard deviation during the aggregation period.Note:Delta and Standard deviation aggregation modes are available from N3uron version 1.21.10.
- Interpolation: Defines the interpolation mode to be used to display the data in the chart. There are 2 available options:
- Rate: Normally Historian only stores records when values change. By default, an unlimited amount of time can pass between records and if the value doesn't change, a new row is never inserted into the database. By modifying these settings, it is possible to specify the maximum and minimum amount of time that can elapse between two samples. It's important to only change this property when necessary.
- Minimum: Minimum amount of time that must elapse before recording new data.
- Maximum: Maximum amount of time that can elapse without recording new data.
- Mode:
Alarms & Events
.png)
- Alarms & Events: This section is explained in detail in the following link: Alarms.