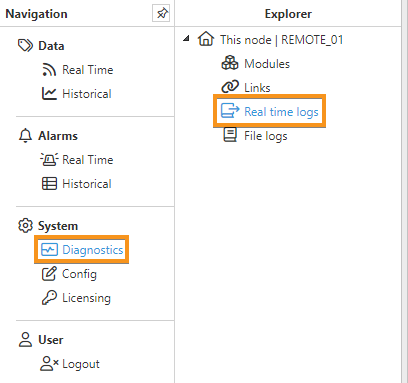
One of the most important troubleshooting tools of WebUI is the Real Time Logs page. This console shows a live flow of log events and errors for every single module instance running in the node, including bootstrap. You can find this page by going to System-->Diagnostics and selecting Real Time Logs in the Explorer panel.
The columns shown in the Real Time logs panel are as follows:
- Timestamp: The timestamp corresponding to the log.
- Level: The Level of the log.
- Module: Module type.
- Name: Event identifier.
- Message: Message for the log.
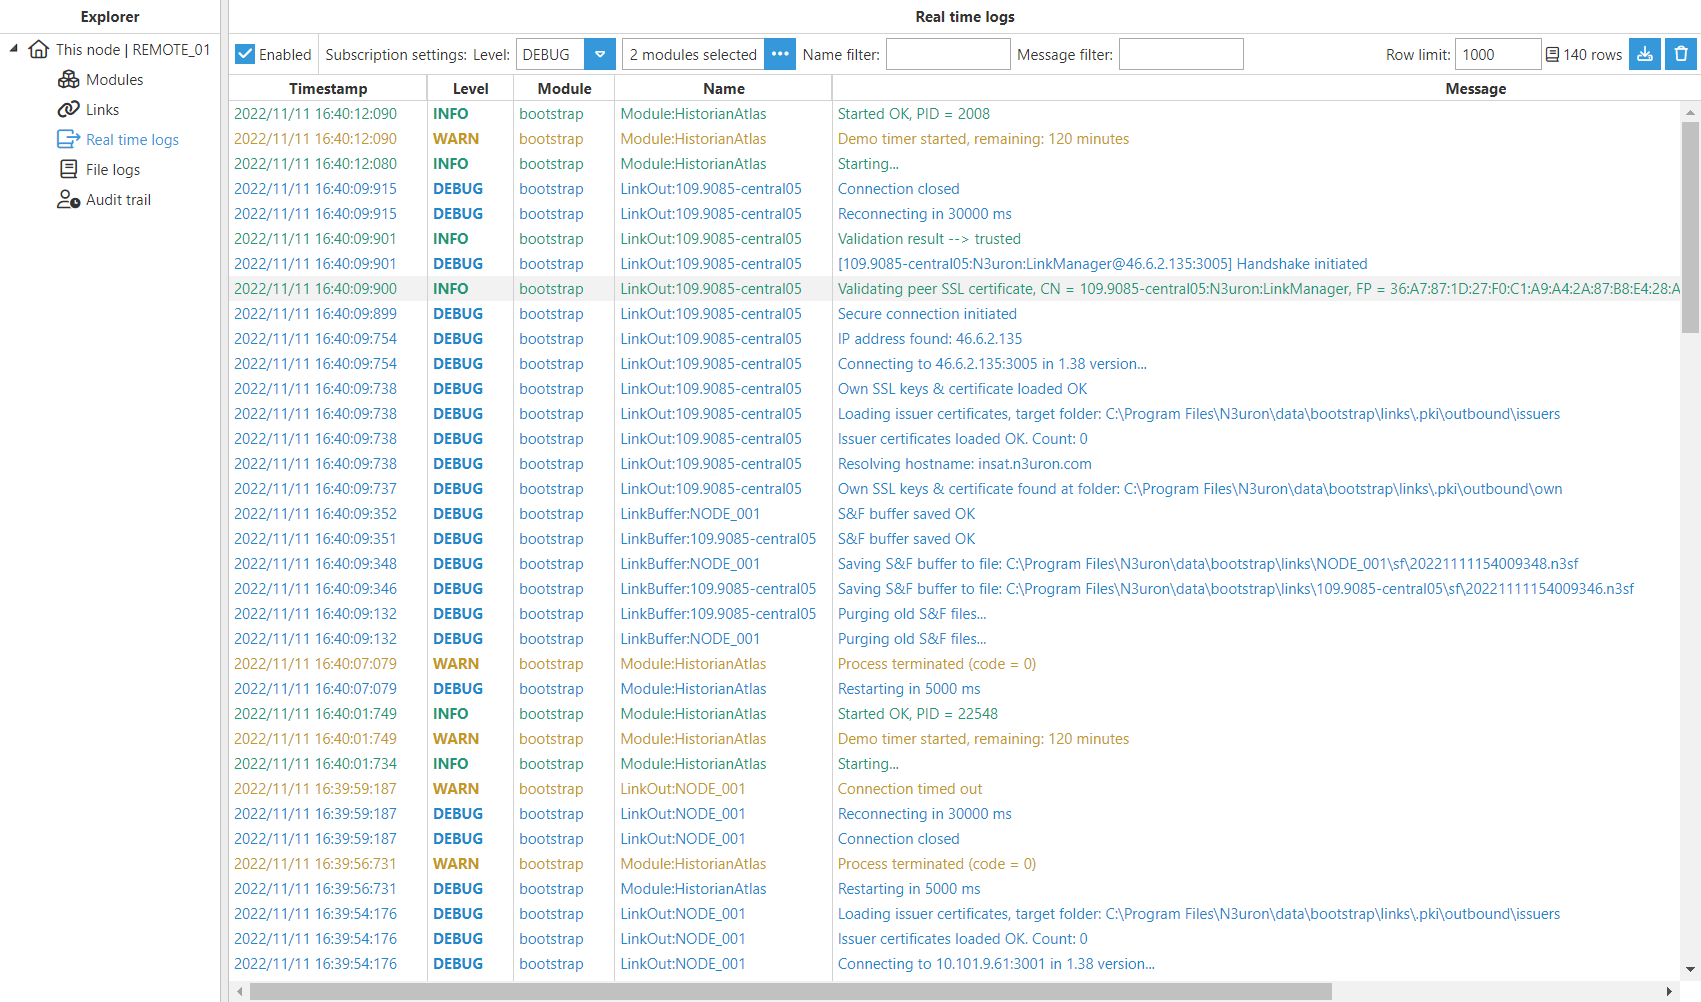
The Real time logs panel will start displaying live values once the Enabled checkbox is selected. The maximum level of detail for the logs displayed will be that selected in the dropdown menu, ranging from ERROR, which represents the minimum level of detail, to TRACE.
Whenever real time logs are enabled, the icon shown in the image below will appear next to the Diagnostics menu in the Navigation panel.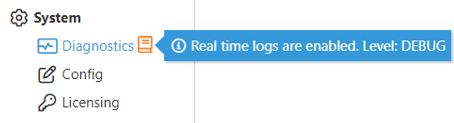
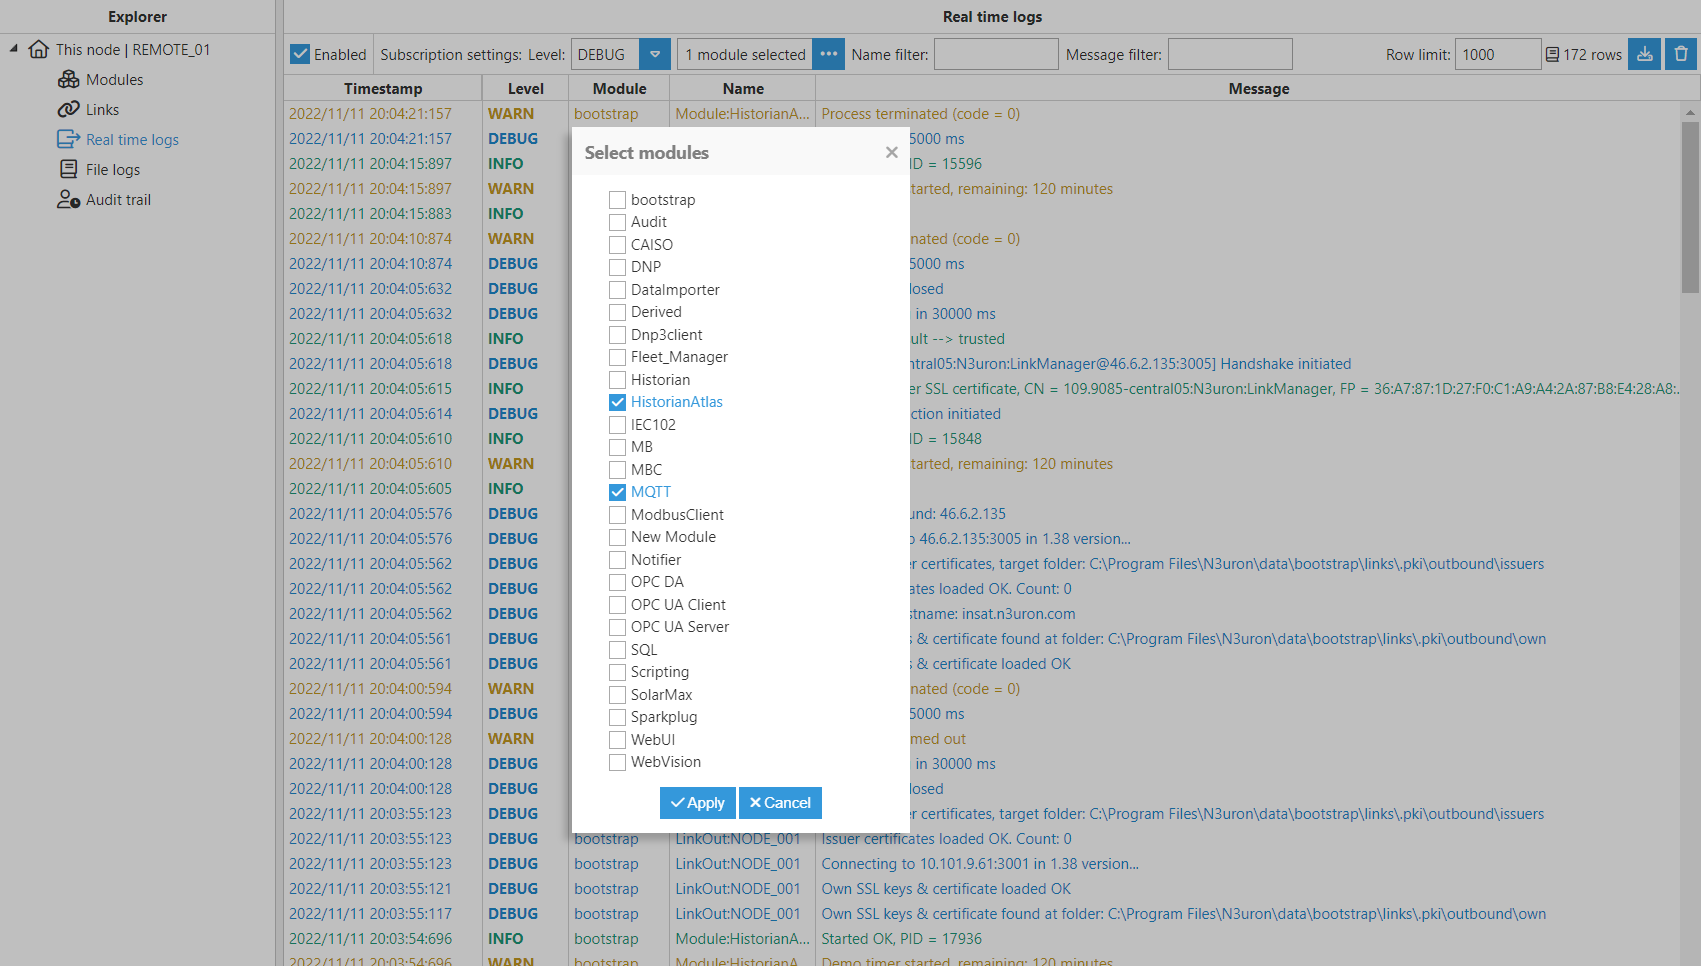
Users can also select the module instances for which they want the logs to be shown and define some filter criteria using the Name filter, the Message filter, or both.
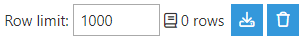
Node logs can also be exported using the button located in the upper-right corner. Next to this button, there is another button to clean the console, as well as a rows counter, and the Row limit input field, which is intended to restrict the total amount of logs displayed.