The WebUI Historical section is a rich HTML5 interface used for visualizing historical data for those tags whose values are being stored in a MongoDB database using N3uron's Historian module. This section of N3uron allows users to configure various parameters in order to monitor the historical data of selected tags. To access the interface, go to Data-->Historical in the Navigation panel.
.png)
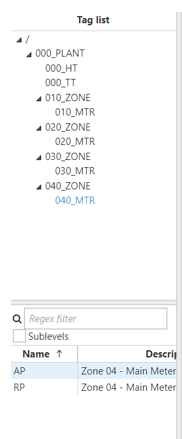
Tag List
On the left-hand side we will find the Tag List browser, which is set up in an interactive tree structure that can be expanded or collapsed to view more tags. By selecting the different levels in the tree, we can filter which tags are available in the bottom panel to be dragged and dropped into the Selected tags panel.
As in the Real Time section, we also have the Sublevels checkbox, which if checked will display all the tags below the selected level in the Tag List tree. Users also have the possibility of filtering the tags displayed in the Tag List by entering a Regular Expression in the corresponding text field. Most features of regular expressions are supported.
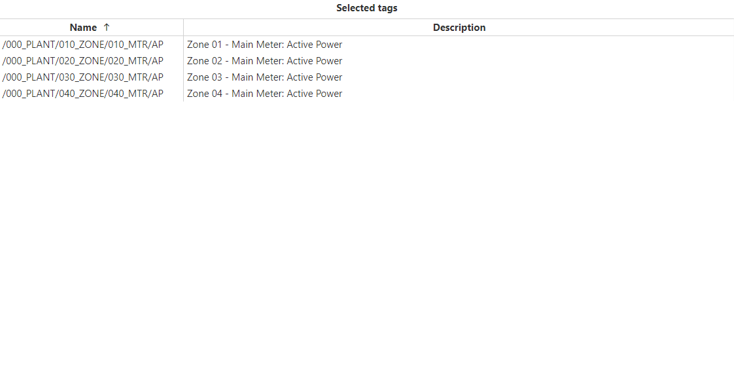
Configuration
Once we have dragged and dropped all the tags that we want to visualize the historical value for in the Selected tags panel, the interface offers a number of configuration options that allow us to customize the way the data will be displayed.
.png)
.png)
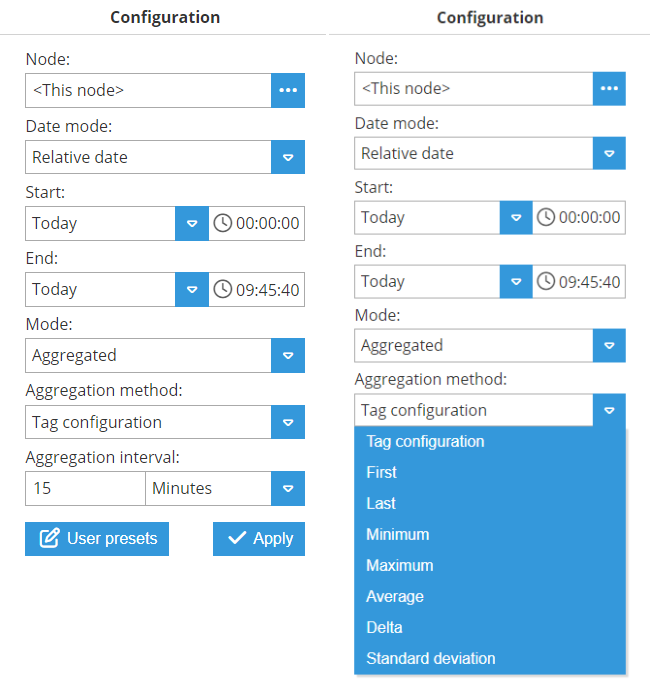
- Configuration: The available configuration options are as follows:
- Node: Allows users to read historical tags via Links.
- Date mode: Allows different ways of specifying the start and end dates for displayed data.
- Relative: Allows users to select the start and end date according to the current date.
- Absolute: Allows users to select a start and end date as absolute dates.
- Current: Allows users to select an interval between the current moment and a previous moment defined by the offset.
- Date: Configuration of the different Date modes:
- Relative: Start and end dates are configured using an offset in days or weeks and a time offset in milliseconds
- Offset: Offset relative to the current moment.
- Time: Absolute offset over the relative offset.
- Absolute: Allows dates to be specified as absolute values.
- Start: Absolute start date.
- End: Absolute end date.
- Current: Allows the date to be specified between a selected negative offset and the current moment.
- Offset: Negative offset from the current date.
- Units: Offset units (seconds, minutes, or hours).
- Relative: Start and end dates are configured using an offset in days or weeks and a time offset in milliseconds
- Mode: Specifies whether or not the stored raw data will be processed in some way before being displayed.
- Aggregated: Allows users to aggregate data using different methods.
- Raw: Presents data as per how it is stored in the historical database.
- Delta: Only presents values when they have surpassed the specified deadband value. Includes all values after the change.
- Filter: Only presents values when they have surpassed the specified deadband value. Includes all values before and after the change.
- Mode configuration: Configuration of properties for the different modes.
- Aggregated:
- Aggregation method: Aggregation type applied to the data. Choose between:
- Tag configuration: It will select the aggregation method configured within the tag configuration.
- Average: Returns the calculated time-weighted average of all good quality values received during the specified period. Periods with bad quality data are excluded from the calculation. If no good quality values are present throughout the entire period, the result will be a bad quality data point.
- Min: Returns the lowest good quality value received during the period. If no good quality values exist during the entire period, a bad quality data point is returned.
- Max: Returns the highest good quality value received during the period. If no good quality values exist during the entire period, a bad quality data point is returned.
- First: Returns the value and its quality at the beginning of the aggregation period. The timestamp also reflects the end of the period.
- Last: Returns the value and its quality at the end of the aggregation period. The timestamp also reflects the end of the period.
- Delta: Returns the difference between the values at the end and beginning of the period, but only if both have good quality. If either value has bad quality, a bad quality data point is returned.
- Standard Deviation: Returns the time-weighted standard deviation of all good quality values received during the period. Periods with bad quality data are excluded from the calculation. A bad quality data point is returned if no good quality values exist during the entire period.
- Custom: Allows you to define a script to calculate the aggregation in a way that best suits your needs.Note:Delta, Standard Deviation and Custom aggregation modes are available from N3uron version 1.21.10.
- Aggregation method: Aggregation type applied to the data. Choose between:
- Aggregation interval: Interval for the aggregated data:
- Value: Interval value.
- Units: Value units.
- Raw: No special configuration, raw values.
- Delta and Filter:
- Deadband: Defines the data change threshold.
- Aggregated:
- User presets: Configuration properties can be saved as presets. Previously saved presets can be loaded by clicking on this button.
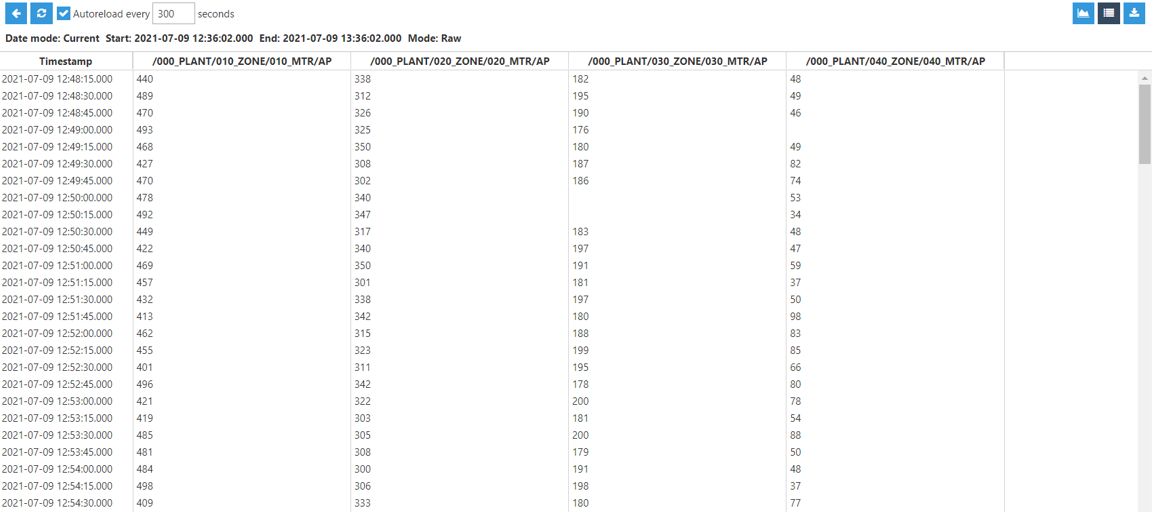
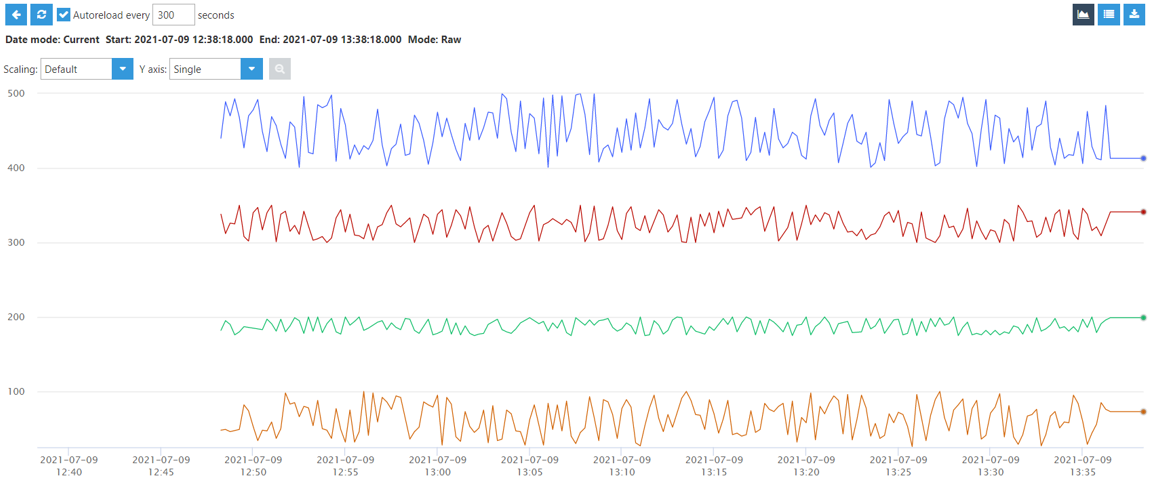
After applying the retrieval parameters in Configuration, the WebUI will show the historical data of the selected tags with the following options:
- Autoreload: Enables a periodic reload of the data.
- Return to configuration view.
- Reload selected tags.
In the upper right corner, there are two buttons which allow users to change between chart and table visualization modes, as well as download the data to a CSV file.
- Download: Downloads a CSV file containing historical data.
- Data visualization: Data can be visualized in two ways: a chart or a table with date/value representation.
.png)