Alarms can be monitored from WebUI and Web Vision. WebUI provides an alarm status table, which displays the current state of the alarm events available to the node, including those provided by remote nodes. To access the interface, go to Alarms-->Real time in the Navigation panel.
Tag Groups
On the left-hand side of the window, we can find the Tag Groups browser, which is set up in an interactive tree structure that can be expanded or collapsed to view more tags. By selecting the different levels in the tree, we can filter which alarms will be displayed in the Alarms panel.
Alarms
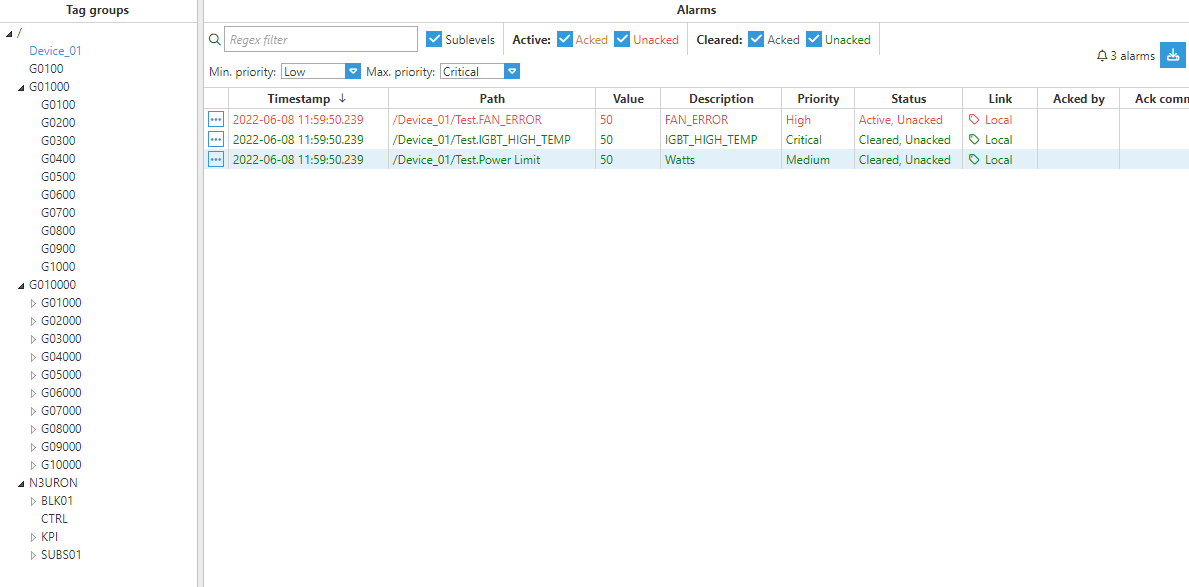
The alarm status table can be configured to show active, unacknowledged, cleared, and acknowledged alarms. By default, it shows all non-cleared/non-acknowledged alarms. It is also possible to filter the alarms depending on their priority level, as shown in the image below.
The Alarms panel is located on the right-hand side and is the panel where the selected alarms are displayed. Below the header we will find the Sublevels checkbox, which, when checked, will display all the alarms below the selected level in the Tag Groups tree. Users also have the possibility of filtering the alarms displayed in the panel by entering a Regular Expression in the corresponding text field. Most features of regular expressions are supported.
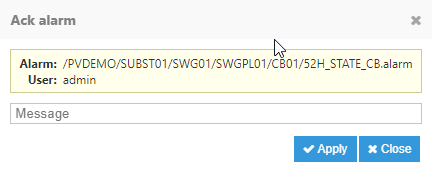
Acknowledgment is handled by selecting one or more alarms and pressing the ellipsis button located on the left of every alarm, followed by the Ack alarm option. This will open a pop-up window (like the one shown in the image below) where users will be able to enter a message before hitting the Apply button.
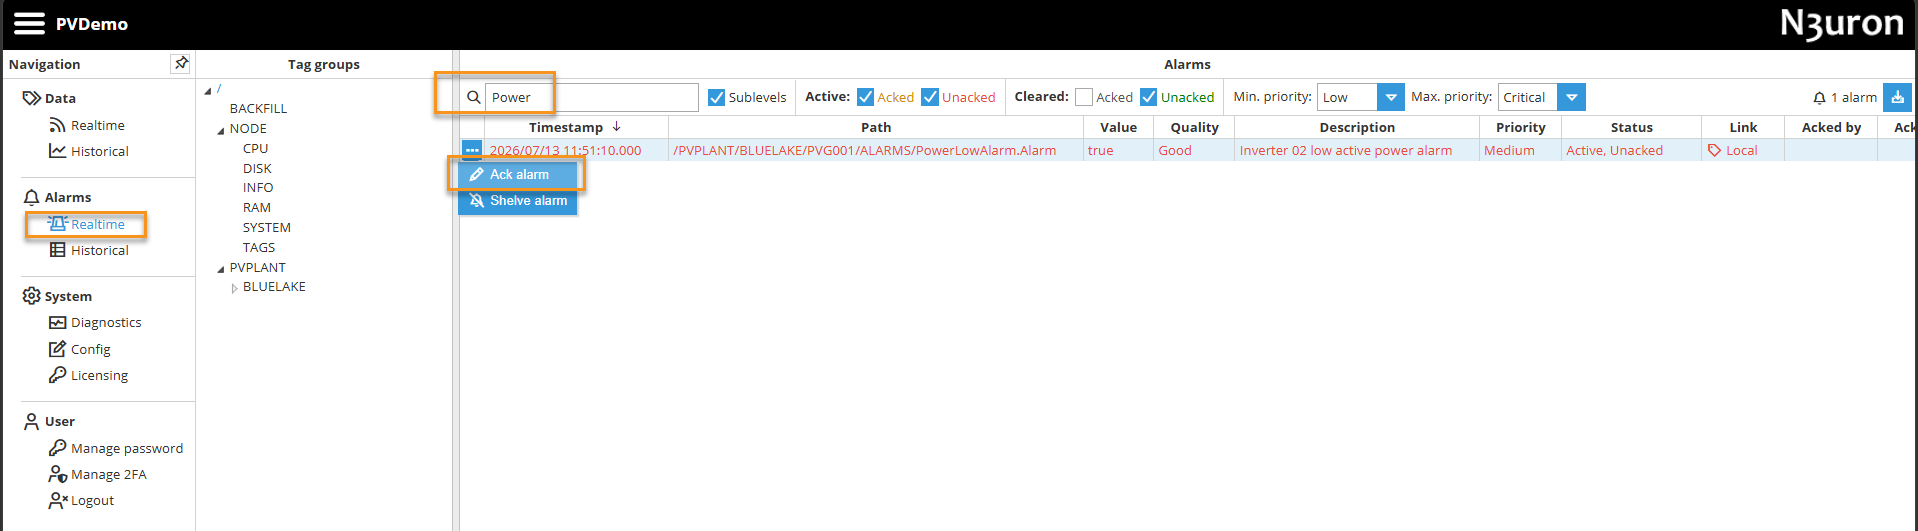
In addition to acknowledgment, an alarm can be temporarily suppressed using Alarm Shelving. Selecting Shelve alarm from the same menu silences the alarm for a configurable period while keeping it visibly marked as Shelved in the Alarms panel. For full details, see Alarm Shelving.
Note:
Alarm Shelving is available from N3uron version 1.22.4 onwards.
The columns shown in the Alarms panel are as follows:
Timestamp: The timestamp corresponding to the alarm event.
Path: Full path of the tag linked to the alarm.
Value: The current tag value.
Description: Provides a description of the alarm.
Priority: Priority level of the alarm.
Status: Combination of the alarm's Active and Acknowledged conditions.
Link: Indicates whether the alarm is Local or specifies which remote node it comes from.
Acked by: User who acknowledged the alarm.
Ack comment: Message entered when the alarm was acknowledged, if any.
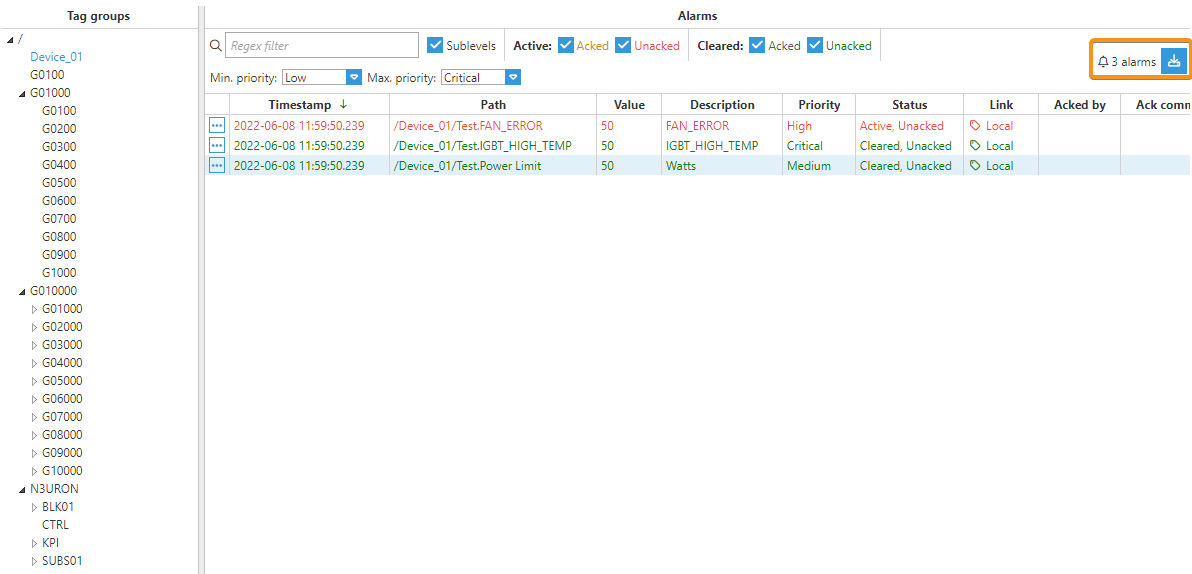
Finally, N3uron allows you to export everything that is being displayed in the Alarms panel to a CSV file by clicking on the button located in the upper-right corner. Next to this button, there is also an alarm counter, which shows the total number of displayed alarms.