WebUI provides a very useful interface that gives you a comprehensive view of all tags, including the current value, datatype, and any traits. To access the interface, go to Data-->Real time in the Navigation panel.
Tag Groups
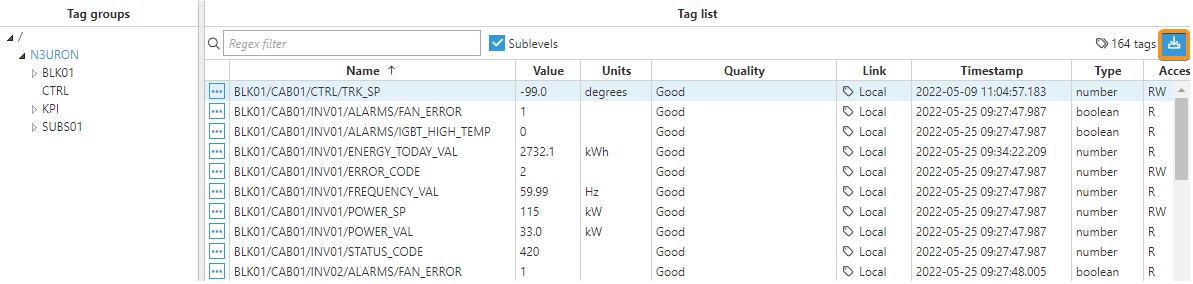
On the left-hand side, we can find the Tag Groups browser, which is set up in an interactive tree structure that can be expanded or collapsed to view more tags. By selecting the different levels in the tree, we can filter what information is displayed on the Tag List panel.
Tag List
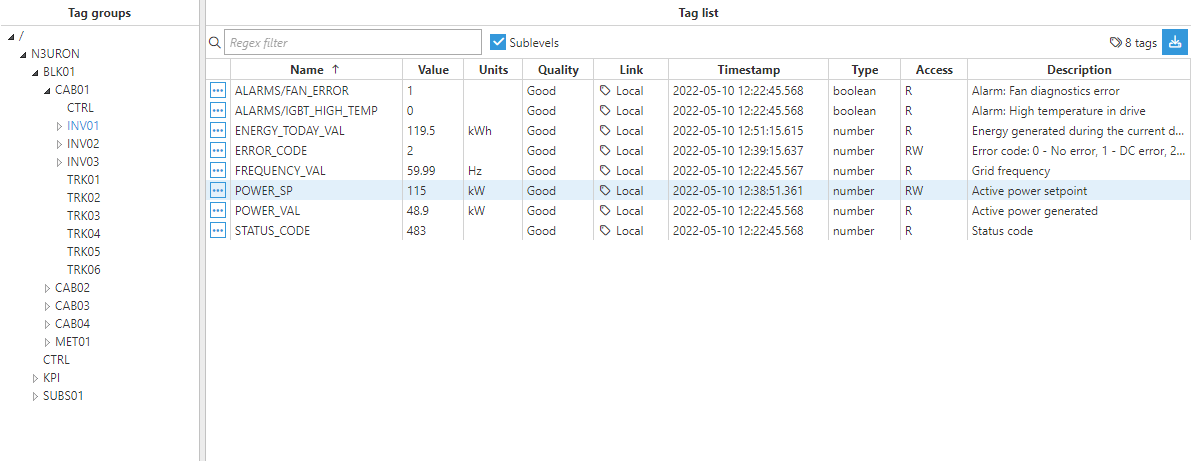
The Tag List panel is located on the right-hand side and is the panel where the selected tag properties are displayed. Below the header, we can find the Sublevels checkbox which, if checked, will display all the tags below the selected level in the Tag Groups tree. Users also have the possibility of filtering the tags displayed in the Tag List by entering a Regular Expression in the corresponding text field. Most features of regular expressions are supported.
The columns in the Tag List are as follows:
- Name: The name of the tag.
- Value: The current value of the tag.
- Units: Shows the engineering units associated with the tag.
- Quality: Shows the quality of the tag. Click here for more information about quality codes.
- Link: Indicates whether the tag is Local or alternatively, the remote node it comes from.
- Timestamp: The timestamp corresponding to the last tag update.
- Type: Indicates the tag data type.
- Access: Shows R or RW, depending on whether the tag has read-only access or not.
- Description: Provides a description of the tag.
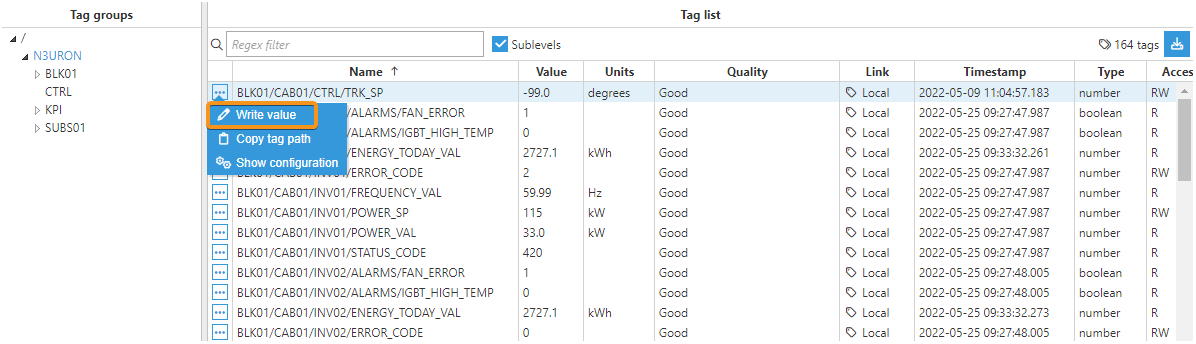
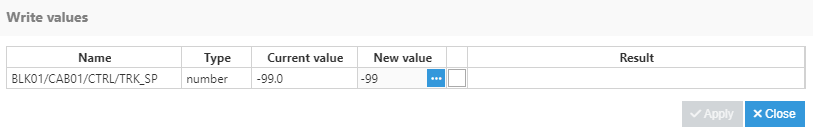
From the drop-down menu displayed after clicking on the ellipsis button located on the left-hand side of every tag, users can copy the tag path, show the configuration of the tag and, for those tags with Write access, it is also possible to write a new value.
Finally, N3uron allows you to export everything that is being displayed in the Tag List to a CSV file by simply clicking on the button located in the top-right corner.