Overview
In the following example, we will see how to connect your N3uron node to Clarify using the Sparkplug Client module, to push all or part of your data model from a single source of truth.
Clarify is a powerful time series intelligence tool designed primarily for industrial teams. Clarify combines a number of features, allowing users to integrate, organize, collaborate and visualize industrial data. It supports a streaming data timeline technology that allows users to quickly navigate and visualize hundreds of data signals at the same time without losing overview or performance.
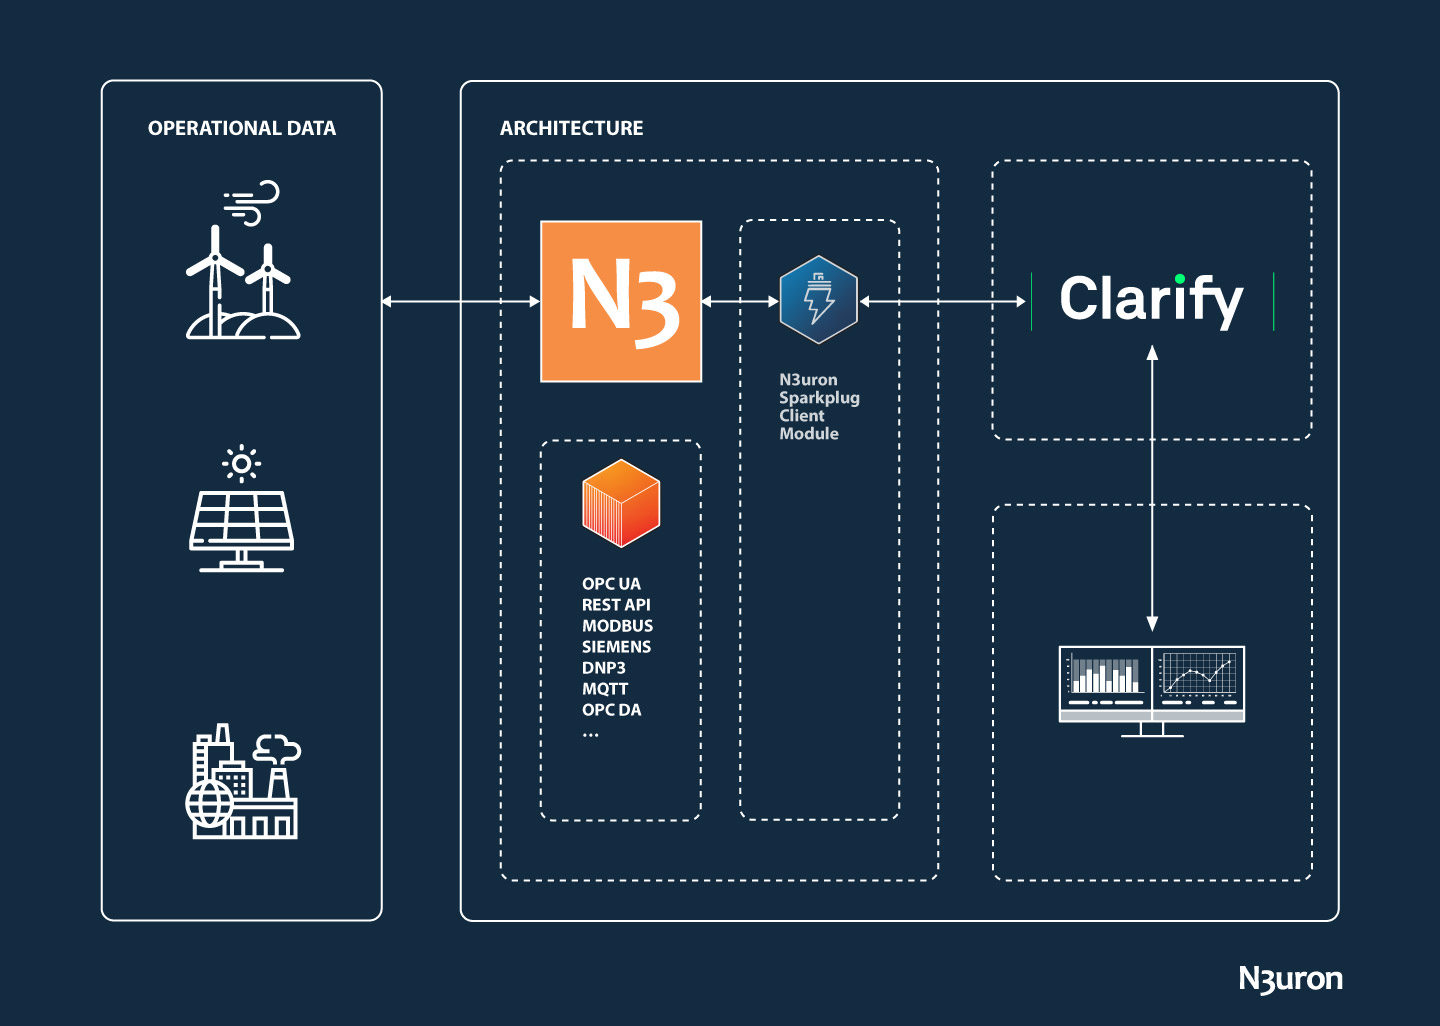
The following image depicts the architecture that will be used in this example.
Clarify Configuration
If you haven't signed up on Clarify yet, click here. Clarify allows integrating up to 30 signals for free.
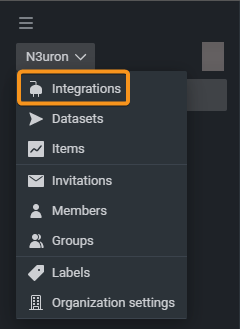
- Step 1: Log in and go to the navigation panel. Expand the drop-down menu by clicking on the organization name and select Integrations.
- Step 2: Click on the Add integration button located at the top right corner.
.png)
- Step 3: In the pop-up window, provide a name for the integration, and an optional description. Click on Create.
.png)
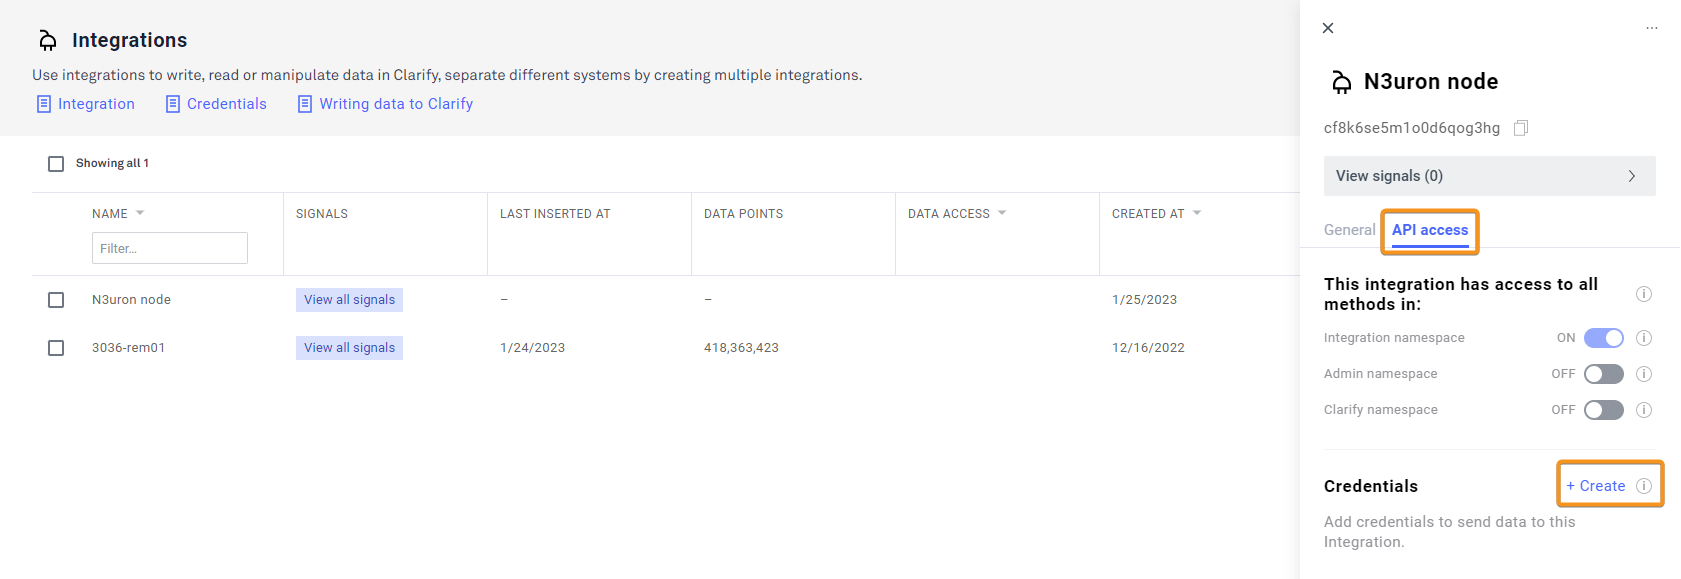
- Step 4: Now, let's create credentials for the Integration. Open the integration's settings by clicking on the integration name and select the API access tab.
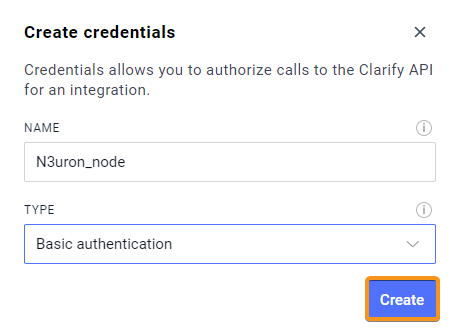
- Step 5: In the pop-up window, provide a name and select the Basic authentication type. Click on Create.
N3uron Configuration
It is assumed that you have already created a Sparkplug Client instance according to the information stated in the Configuration section.
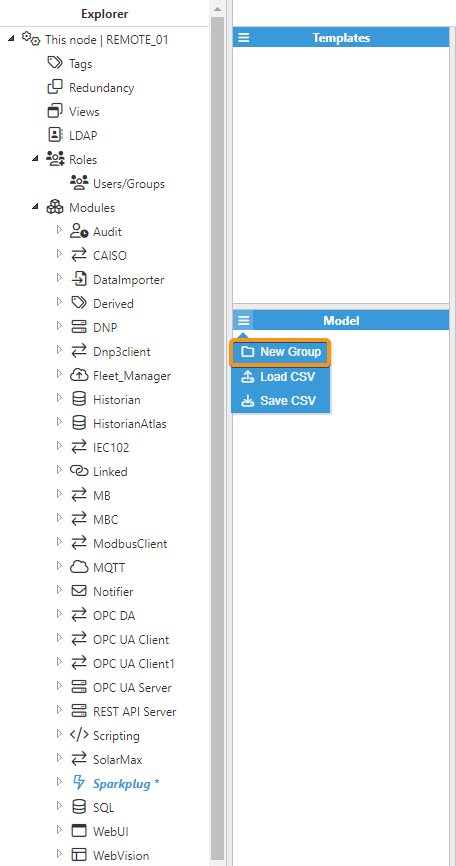
- Step 1: Select your module instance from the Explorer Panel, click the button on the left-hand side of the Model header, select New Group, and give it a name. In this case, Clarify.
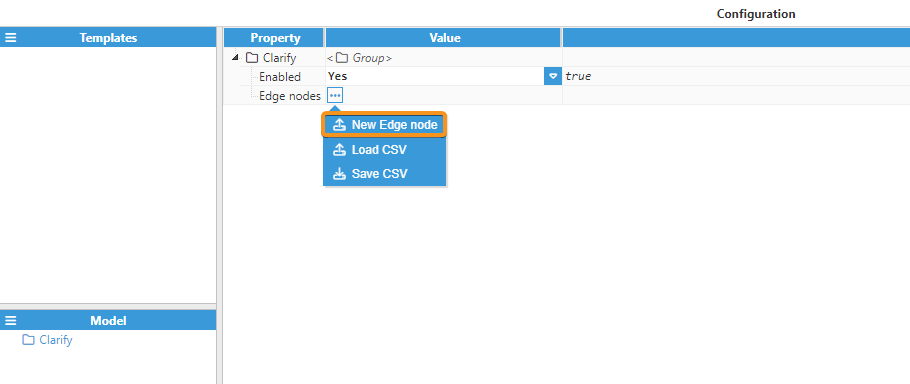
- Step 2: Once the Group has been created, click on the Edge nodes button and select New Edge node, as shown in the image below.
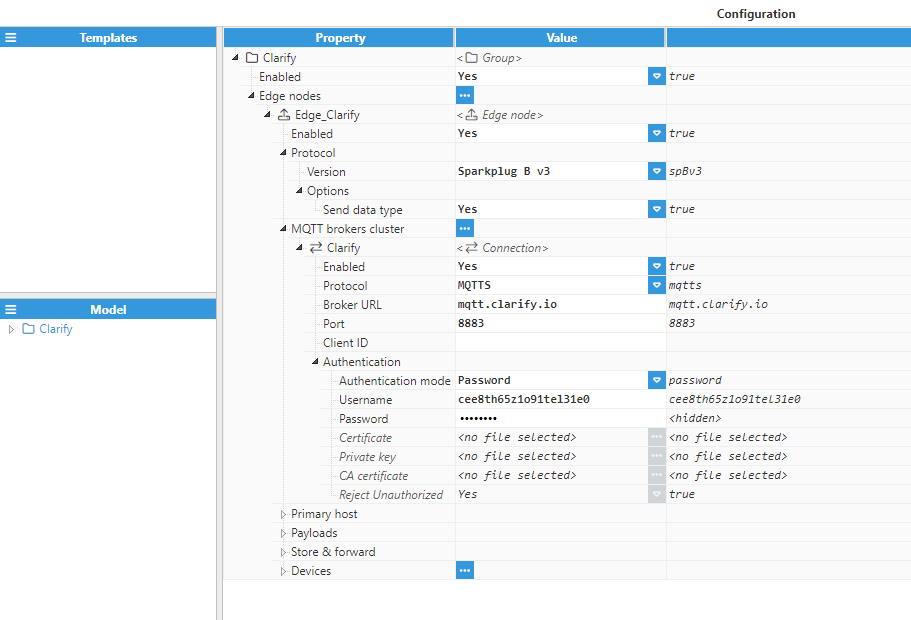
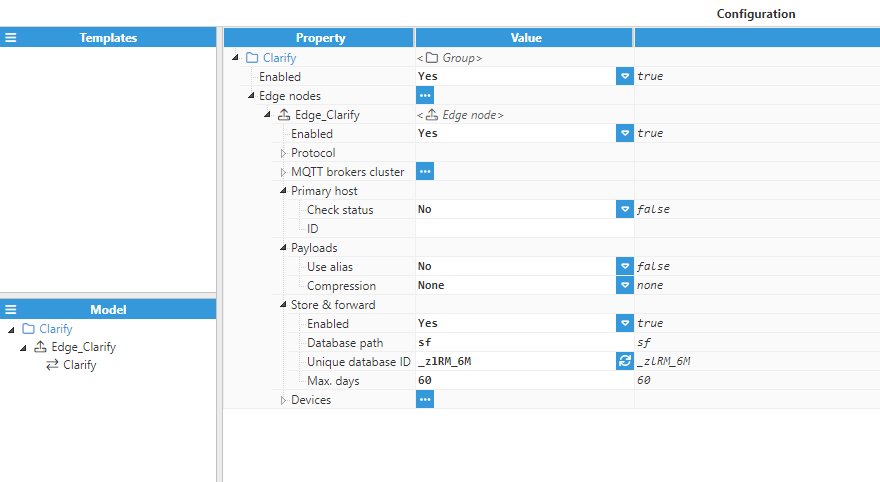
- Step 3: Provide a name (in this case, Edge_Clarify) and configure the rest of the parameters as follows:
- Enabled: Yes.
- Protocol: Sparkplug B v3.
- Version:
- Options:
- Send data type: Yes.
- MQTT Broker cluster: Click on the ellipsis button, select New Connection and enter a name, we have used Clarify. Now, configure the connection as shown in the image below.
- Enabled: Yes.
- Protocol: MQTTS.
- Broker URL: mqtt.clarify.io.
- Port: 8883.
- Client ID: Leave it blank.
- Authentication mode: Password.
- Username: Enter the user provided when you created the credentials in Clarify.
- Password: Enter the password provided when you created the credentials in Clarify.
- Primary Host:
- Check status: No.
- Payloads:
- Use Alias: No.
- Compression: None.
- Store & Forward:
- Enabled: Yes.
- Database Path: sf.
- Unique Database ID: Assigned at random.
- Max. Days: 60.
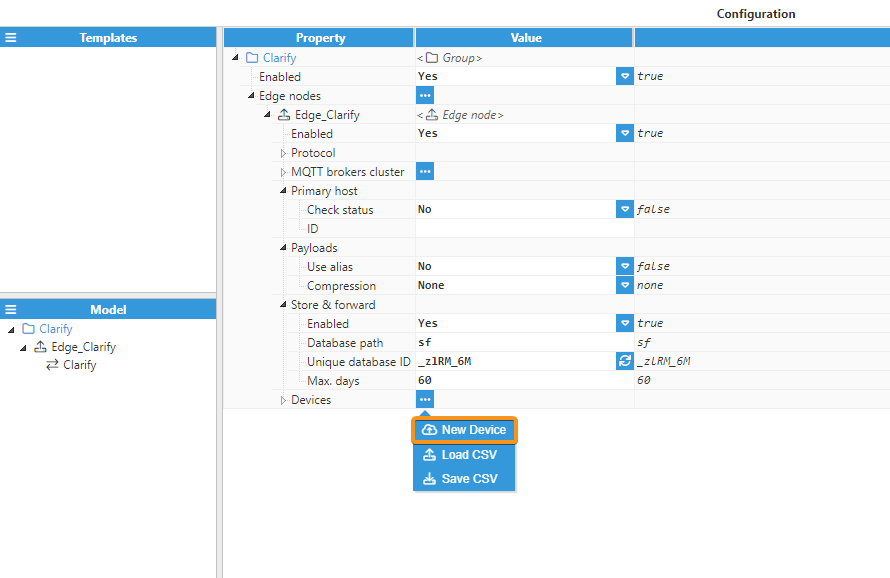
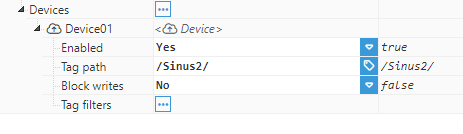
- Step 4: Once the Edge node is configured, we need to create a new Device. Click on the Devices button under the node, select New Edge Device, and give it a name, as shown in the image below. In this example, we have named it Device01.
- Step 5: If you don't want to publish the whole data model, select the path of the tags whose values you want to push to Clarify.
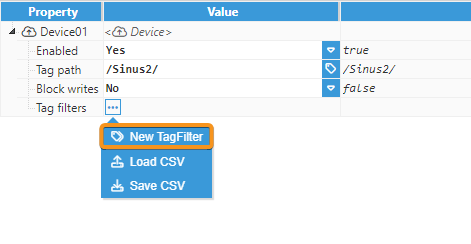
- Step 6: Regardless of whether or not you want to restrict the tags within the Tag Path that will be eventually published, it is needed to create a filter. To do so, click on the ellipsis button and select New Tag Filter, as shown below.
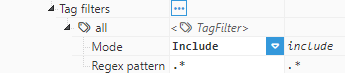
- Step 7: Provide a name (in this case, all) and leave the configuration with its default values in order to publish all tags under the path we entered above.
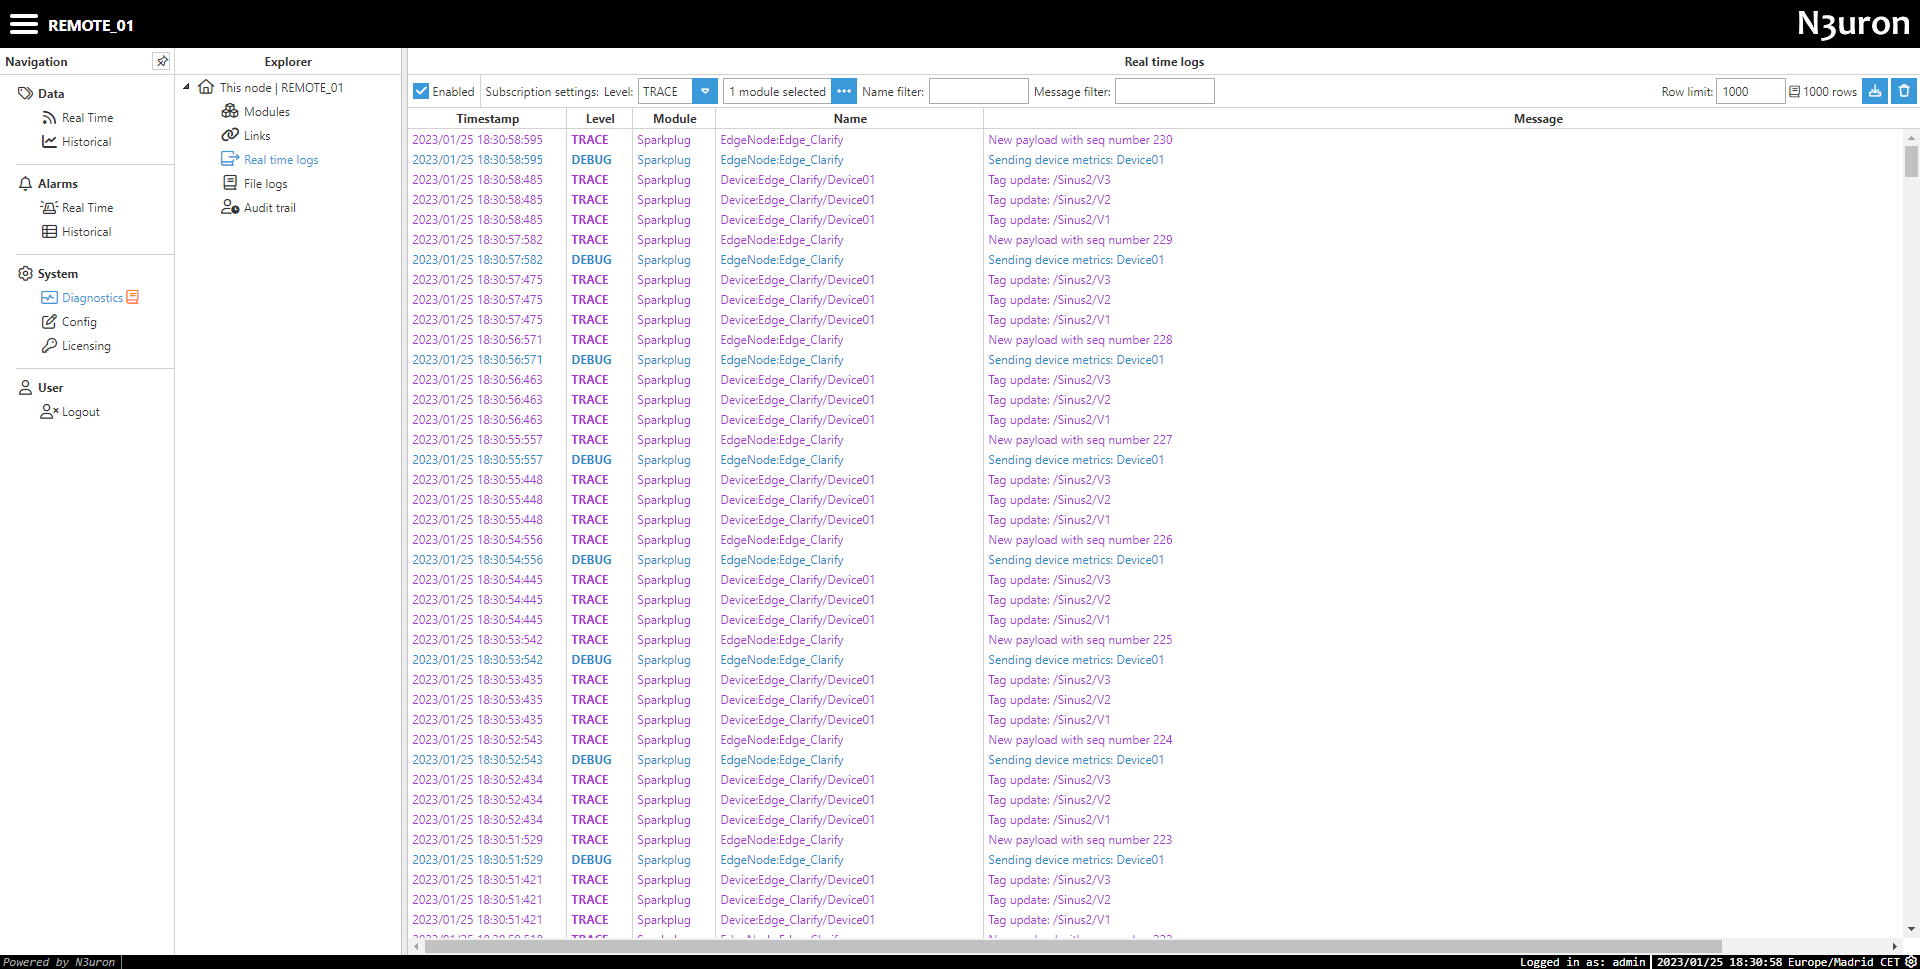
If everything has been configured properly you should be able to see, from Diagnostics, how the data is automatically pushed to Clarify.
Visualizing Data on Clarify
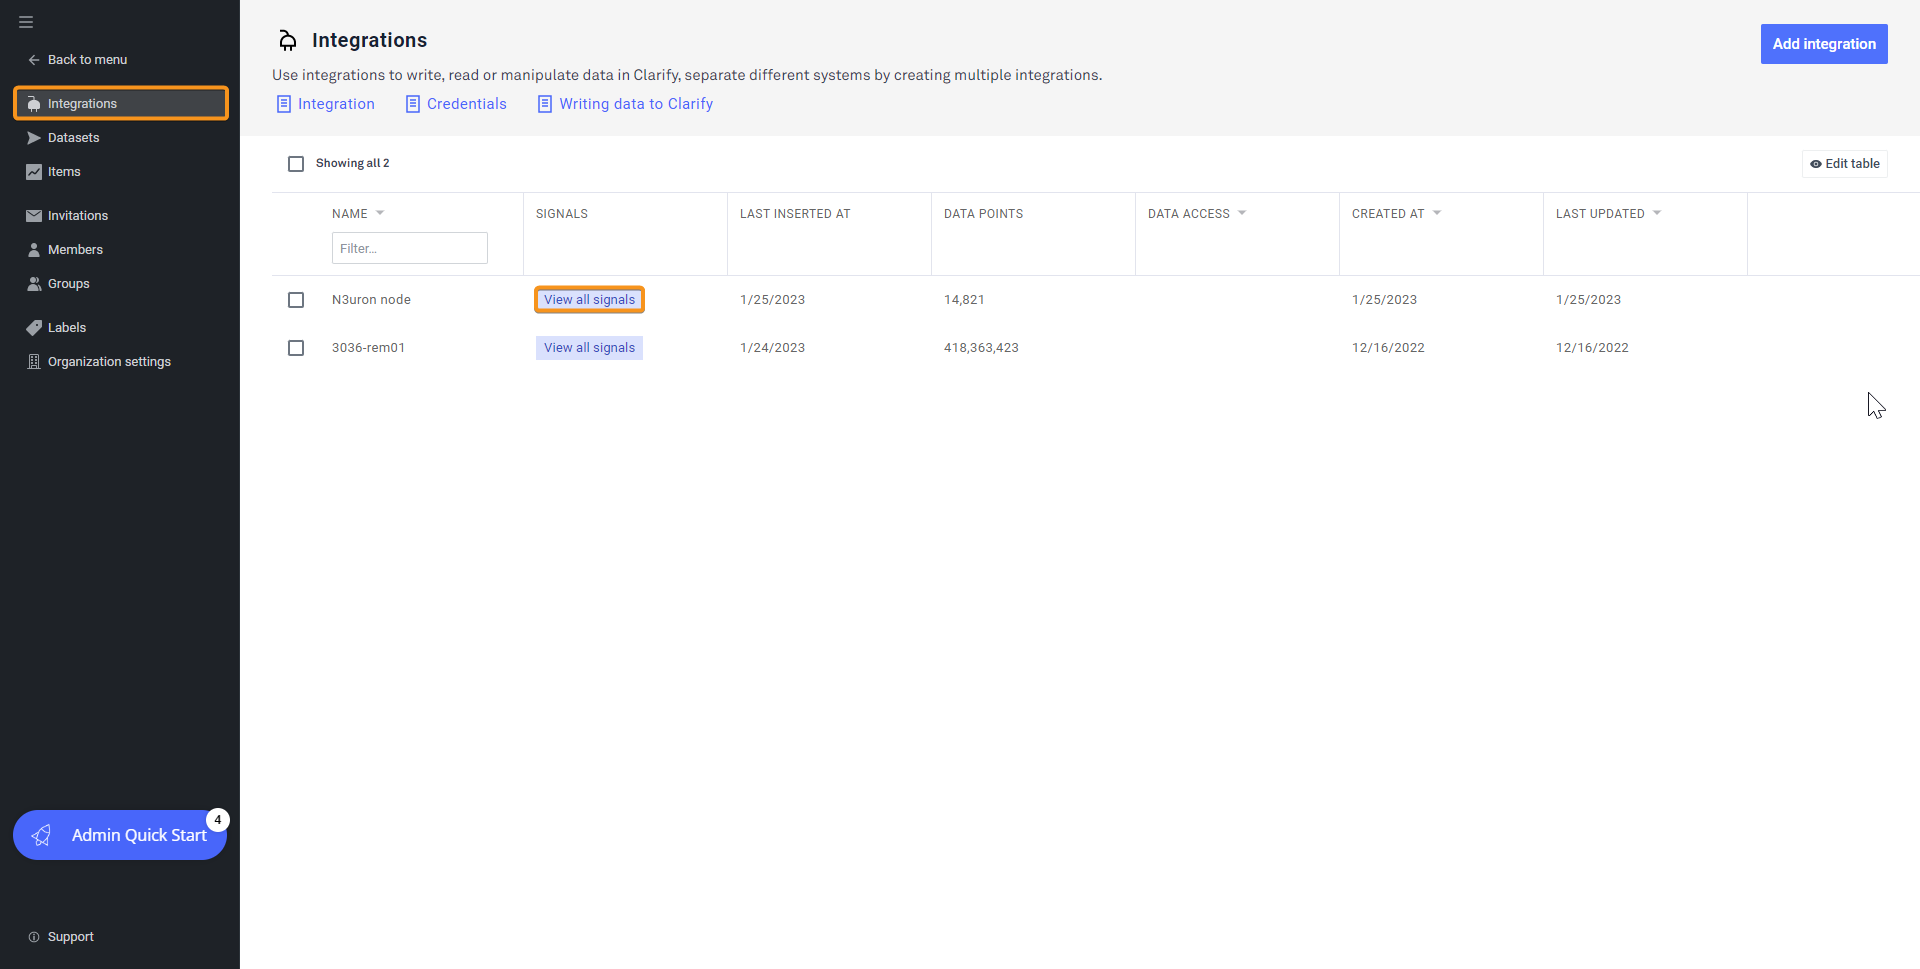
- Step 1: Go to the Integrations panel and click the View all signals button next to your Integration.
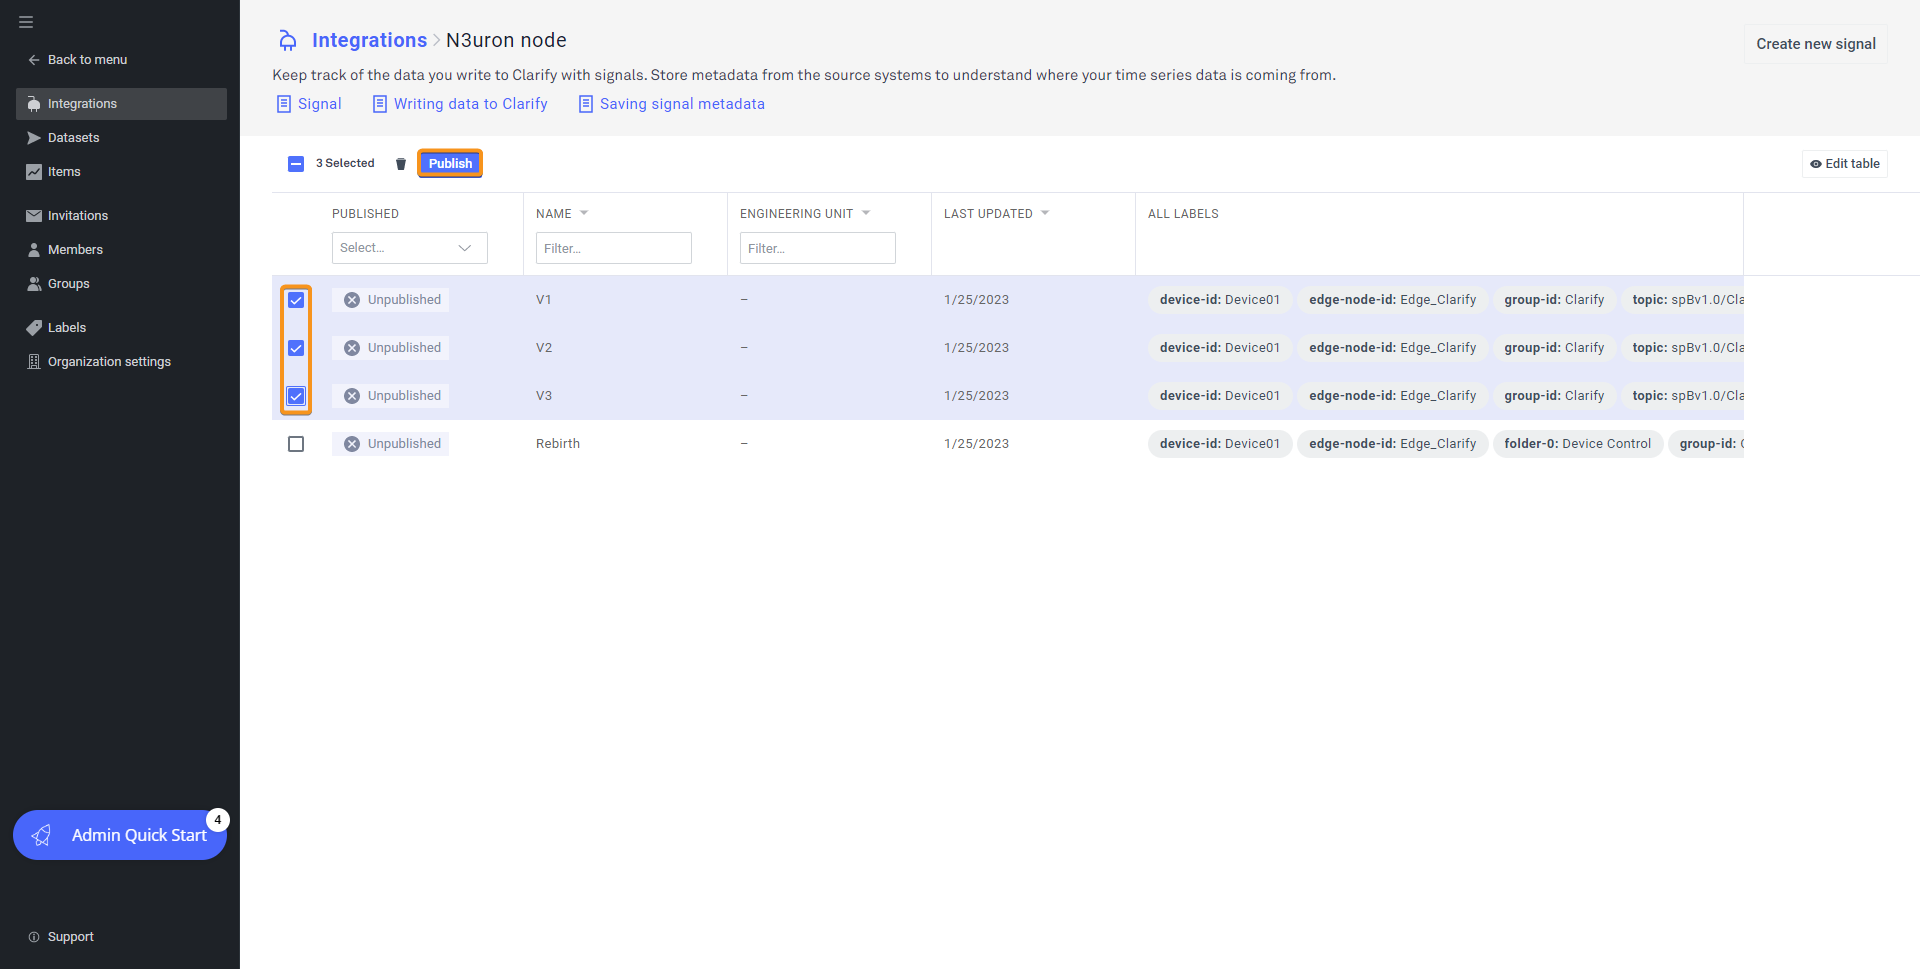
- Step 2: Select the tags you wish to publish and click the Publish button.
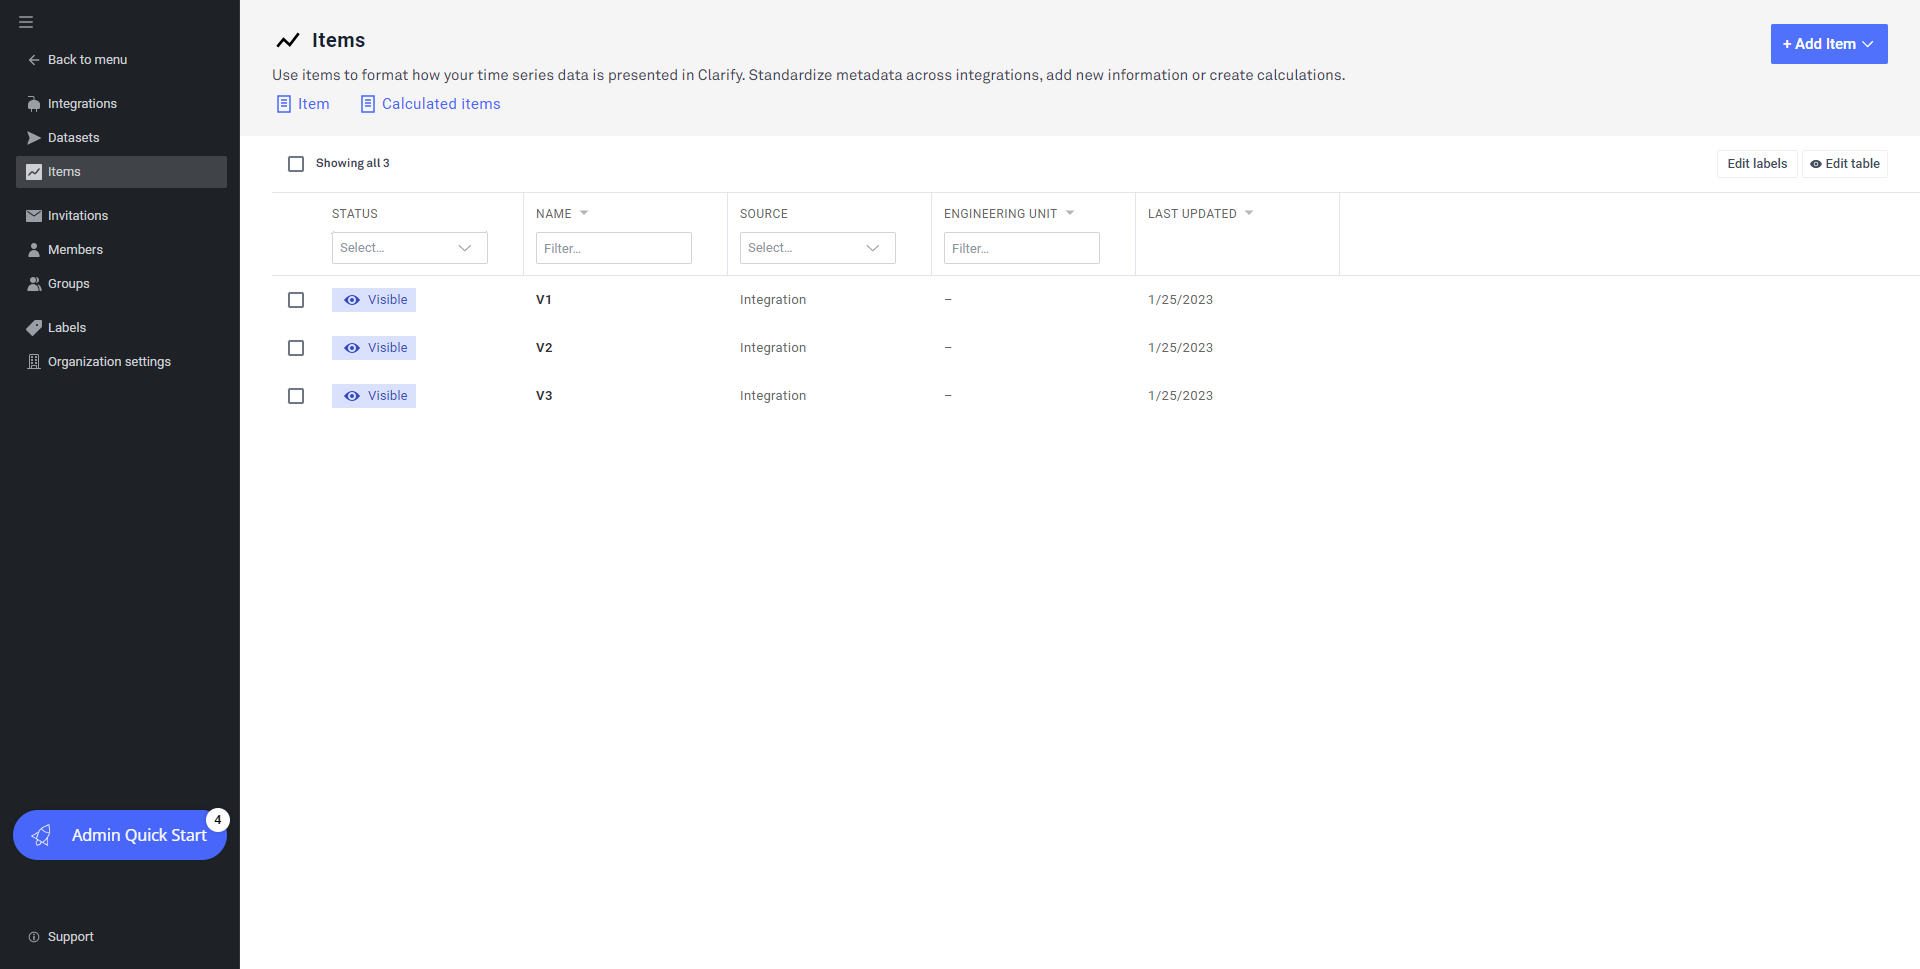
- Step 3: Go to the Items panel and confirm that the status of all published tags is Visible.
- Step 4: In the main menu, click on the New timeline button located at the bottom of the left panel.
.png)
- Step 5: Add your items by clicking on the button to the left of each of them and that's it. Now, you will be able to visualize your data, add comments, and share the timeline you have just created with the members of your organization.
.png)
Sparkplug Client Full Product Details