Simplify Your Industrial Data Management with N3uron, HiveMQ, InfluxDB and Grafana using Docker Containers
Overview
Industry 4.0 has unleashed a wave of cutting-edge innovations, presenting businesses with unparalleled opportunities to boost operational efficiency and sharpen their competitive edge. However, fully harnessing these benefits requires companies to rise to the challenge of real-time data collection, processing, and monitoring. Investing in the right tools, processes, and expertise is crucial for effectively managing data and extracting actionable insights that drive business value. Additionally, adopting open architectures is paramount for avoiding technical debts that can impede interoperability and scalability in the future. By carefully selecting the right technologies, companies can future-proof their operations and continue reaping the rewards of Industry 4.0 and any forthcoming advancements in the field.
In this article, we will describe a reference architecture for deploying an intelligent data hub for the Industrial Edge using Docker containers. One of the key benefits of this architecture is its simplicity and scalability.
Before we dive into the technical details, let's briefly introduce the tools we'll be using:
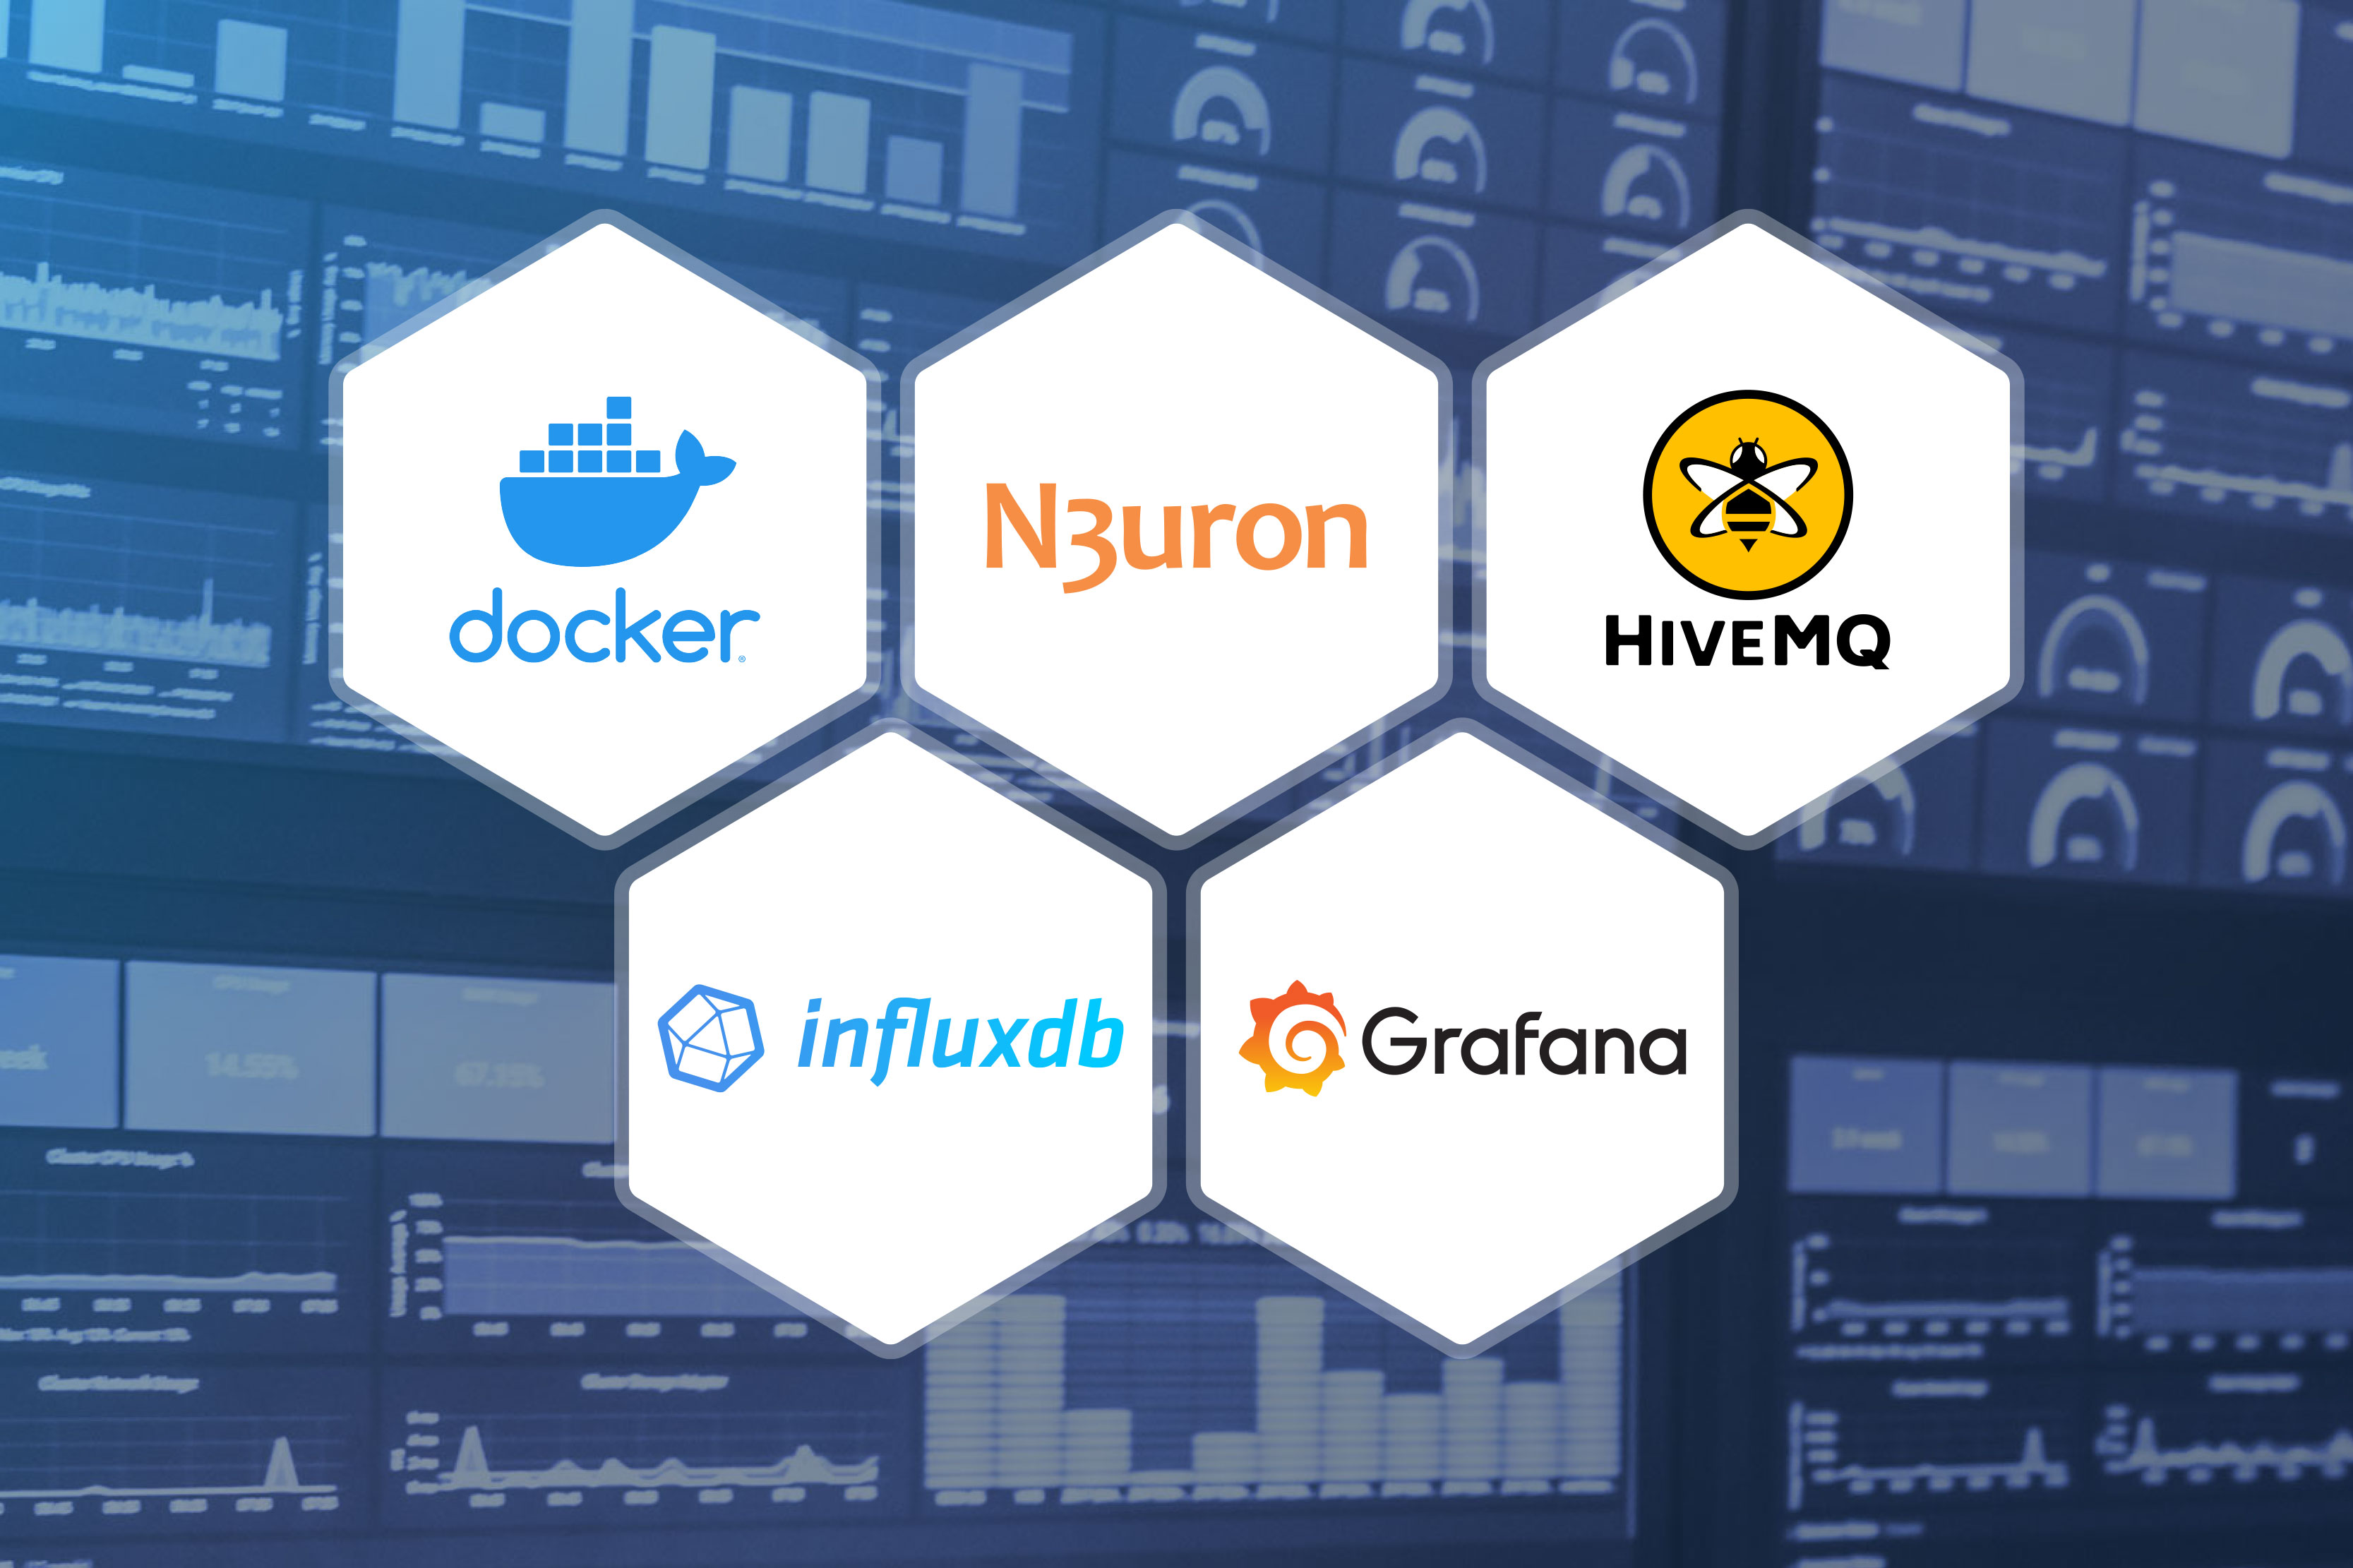
- N3uron: A lightweight industrial platform for DataOps that runs on devices at the edge of the network.
- HiveMQ: An MQTT broker that provides a scalable and reliable messaging infrastructure for applications.
- InfluxDB: A time-series database that is optimized for storing, querying and visualizing time-stamped data.
- Grafana: A popular open-source platform for visualizing and analyzing time-series data.
- Docker: A containerization platform that allows you to package applications and their dependencies into lightweight, portable containers.
Containers have entirely changed the way software is built, packaged, distributed, deployed, and managed. They are lightweight, portable, and self-contained environments that package software applications and their dependencies. Containerized workloads are easier to deploy and manage at scale, their isolated and self-contained nature ensures a consistent and frictionless experience.
By using containers, organizations can benefit from many advantages that can help them improve their operations and stay competitive in a rapidly evolving landscape. Some of these key advantages are as follows:
- Optimized resource usage: Containers are lightweight and more efficient than virtual machines. Many containers can be placed in a single host using fewer resources and delivering higher utilization. This can help to reduce infrastructure costs and improve overall efficiency and scalability.
- Portability: Containers are self-contained and can be easily moved between different hosts or environments, allowing for a “write once, run anywhere” approach.
- Standardization: Containers provide repeatable development, build, test, and production environments.
- Faster application execution: Compared to traditional virtual machines containers start almost instantly and are small in size, helping organizations drive greater visibility and throughput for operations.
- Scalability: Containerized workloads can be easily deployed to multiple hosts and scaled up and down both vertically (by adding more resources to a single container) and horizontally (by adding more containers) to meet changing demand.
- Interoperability: Easy sharing via public or private repositories helps organizations boost the launch of new strategies and technologies.
- Efficient build and test: Built-in mechanisms for versioning and component reuse help organizations increase their operational efficiency.
This proof of concept will show in detail how to set up an affordable, robust and fully scalable solution for the Industrial Edge using N3uron, HiveMQ MQTT Broker, InfluxDB and Grafana. This stack is great for any industrial use case because it provides a bunch of functionalities altogether. It can collect, process, store and display operational data in no time.
With over forty-five modules, ranging from traditional industrial protocols such as Modbus, DNP3, OPC UA, or OPC DA to more conventional protocols like MQTT, Sparkplug or REST, N3uron provides a turnkey connectivity solution for the Industrial Internet of Things (IIoT). Nevertheless, N3uron is not only a connectivity platform, but it is mainly meant to build an deploy an enterprise Unified Namespace (UNS) by modeling, aggregating, standardizing, and contextualizing data on the plant floor from a multitude of sources whether that will be PLCs, databases, manufacturing execution systems, SCADAs or ERPs just to name a few, and make this data available to other third-party applications running either on-premise or in the cloud.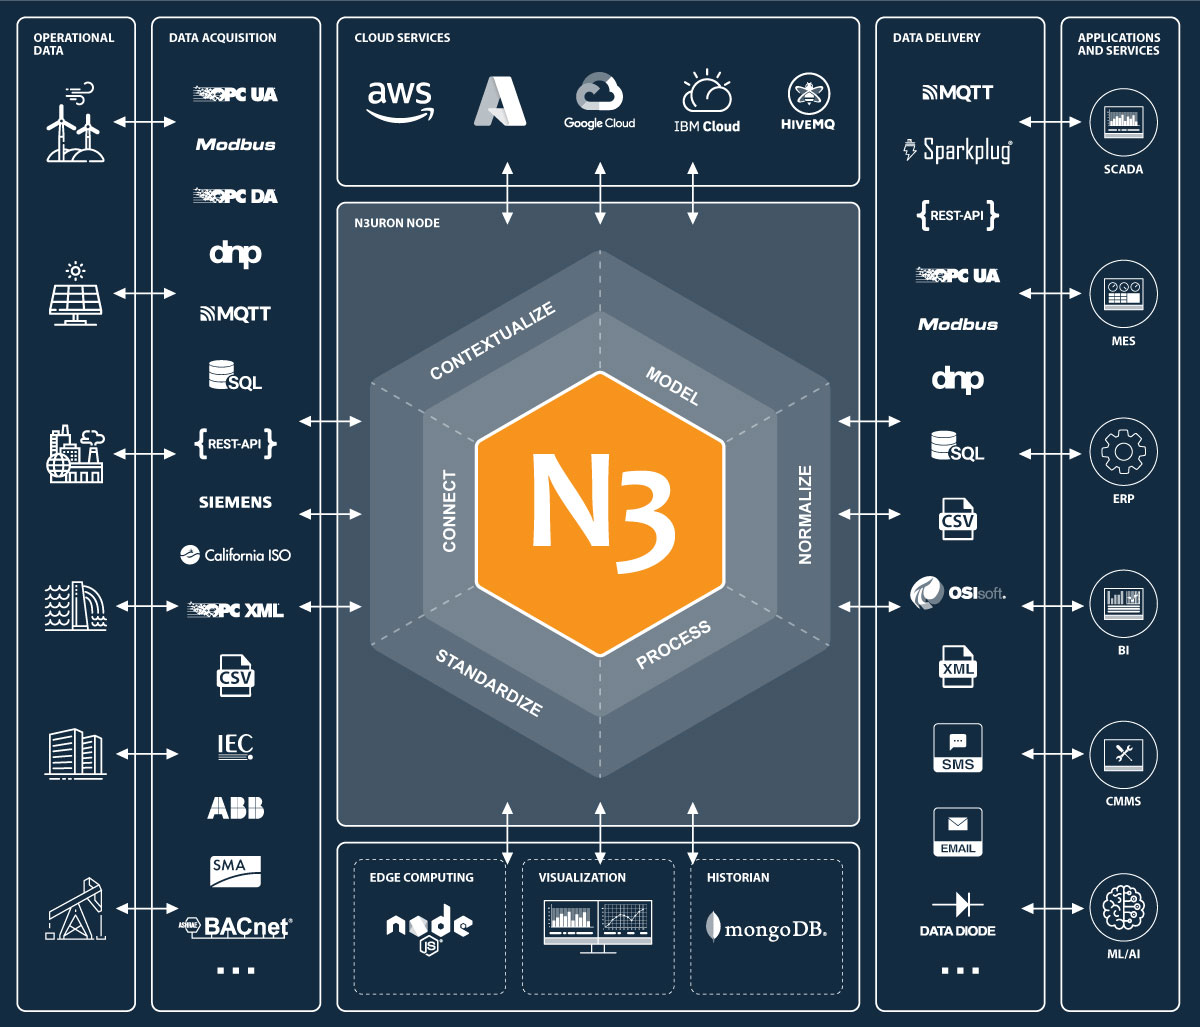
By deploying N3uron together with an MQTT Broker you can rapidly build a local Unified Namespace (UNS) on the plant floor. This provides many benefits such as simplified data integration, cost reduction, improved agility, quality and security. Adding InfluxDB and Grafana to the stack will offer additional capabilities such as fast storage and retrieval of time series data and the ability to quickly create visualizations of data through Grafana’s dashboards.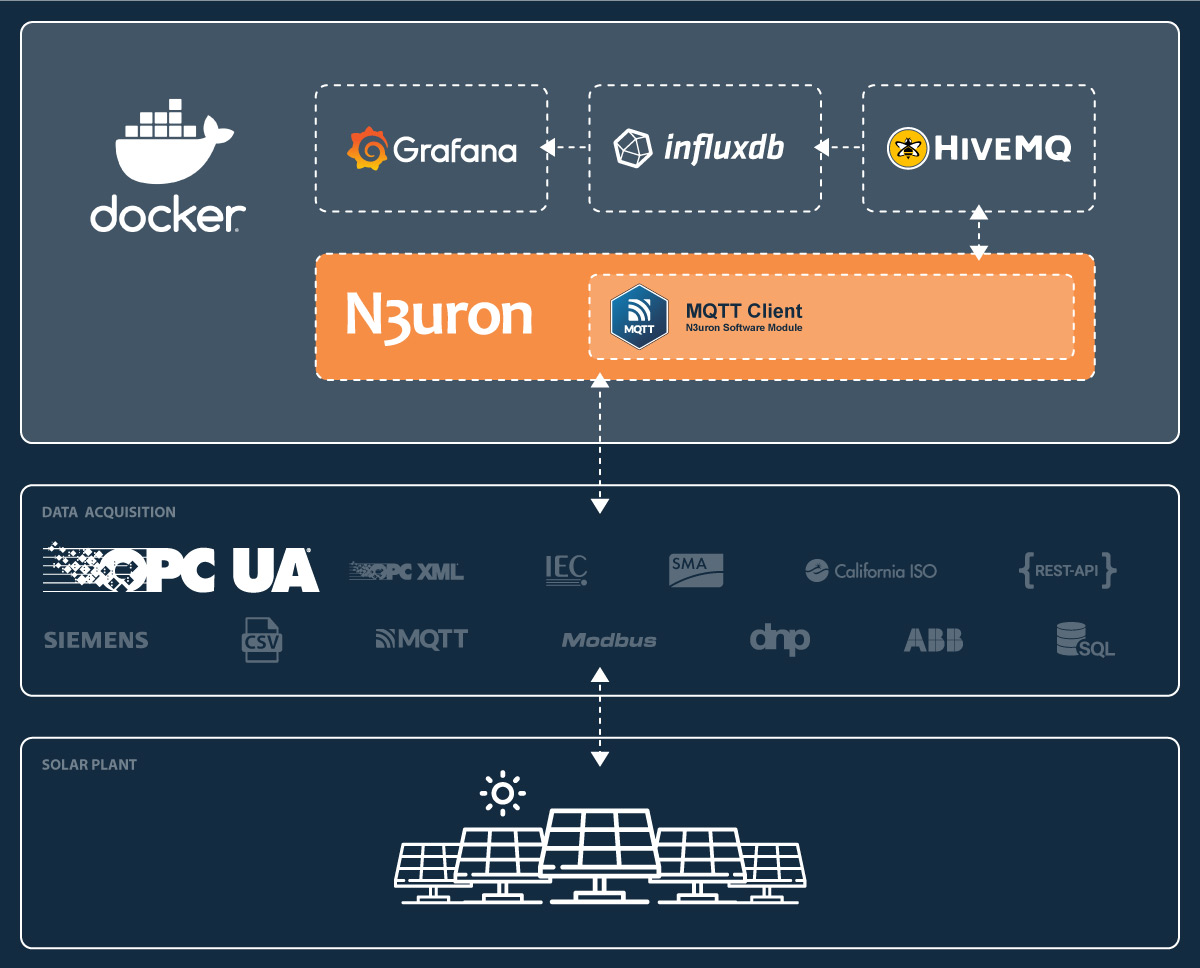
Once you have completed the configuration steps outlined in the following sections, you will have a fully functional proof of concept with real-time data streaming from a Photovoltaic Plant located in Europe. This data, received through a remote OPC UA Server, will flow seamlessly through your local N3uron instance and be displayed on your Grafana dashboard.
Getting Started
To get started you'll need a working Docker environment installed on your computer. If you don't already have Docker installed, you can follow the instructions provided on the official Docker documentation at https://docs.docker.com/get-docker/.
Once you have Docker installed and running, you can proceed to clone our demo repository using Git. If Git is already installed on your computer, you can use the following command to clone the repository to your local machine:
git clone https://github.com/n3uron/ming-dockerThis will create a local copy of the repository on your computer, allowing you to access the source code and run the demo application locally.
If you don't have Git installed or prefer to download the repository as a ZIP file, you can do so by visiting the GitHub repository at https://github.com/n3uron/ming-docker and selecting the Download ZIP option from the Code dropdown menu. Once the ZIP file has finished downloading, you can extract its contents to a directory on your local machine.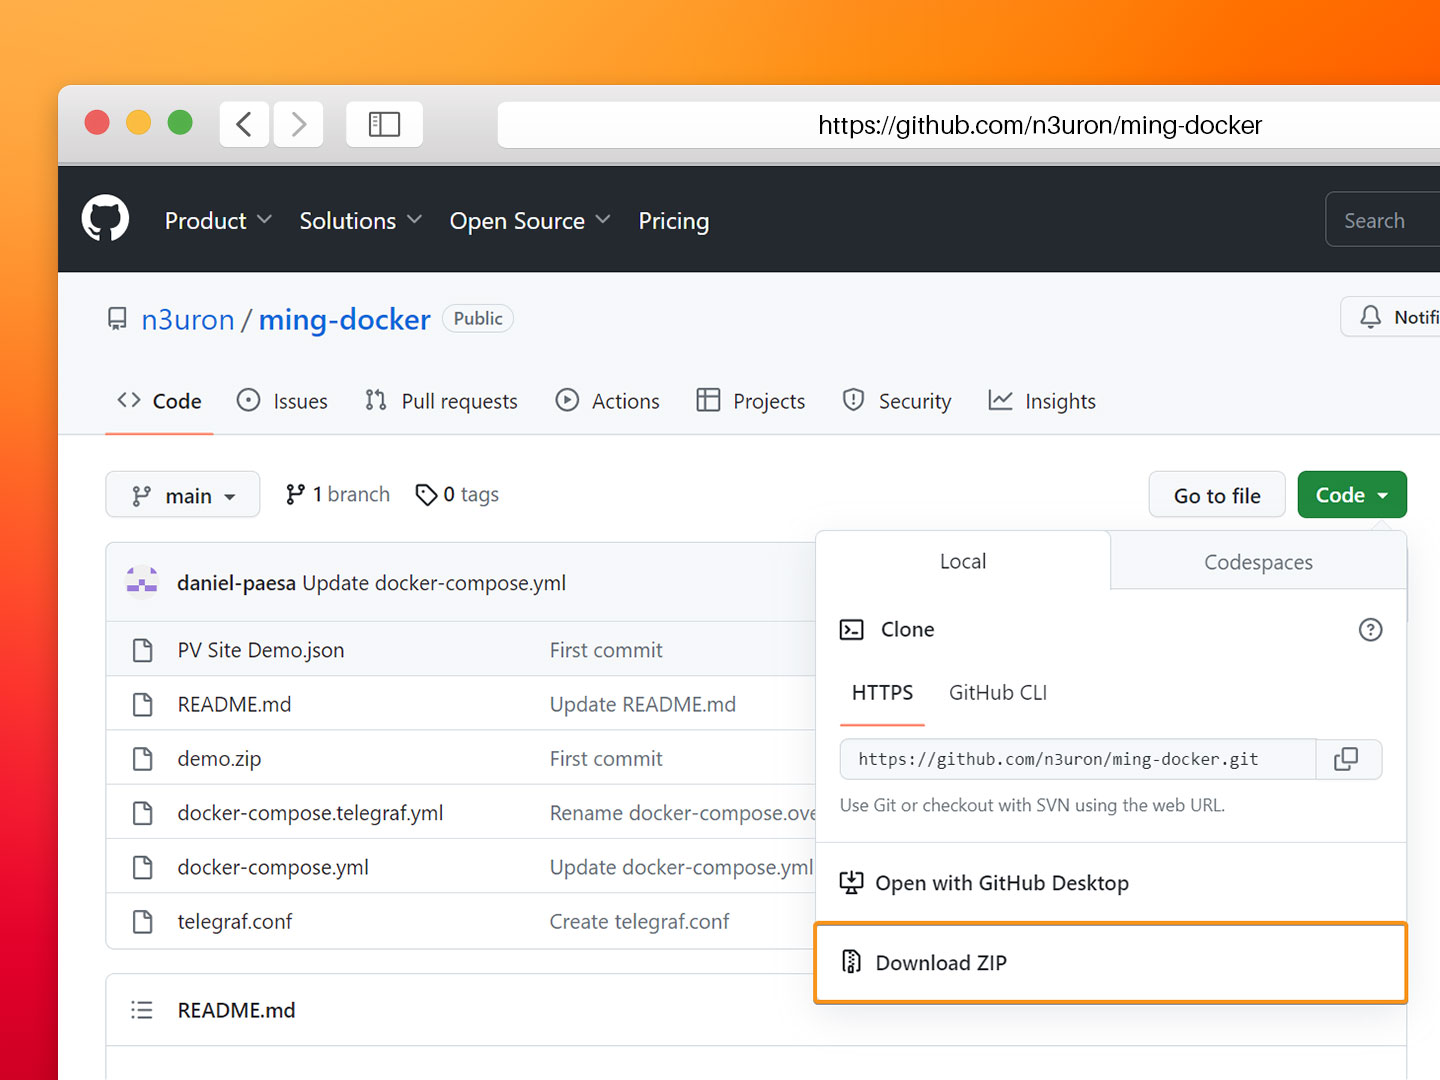
Once you have cloned the repository and have a working Docker environment set up on your computer, you can launch all the necessary services using Docker Compose. To do this, open a terminal in the directory where you have cloned the repository and enter the following command:
docker compose -f docker-compose.yml up -dThis command will launch all the necessary containers and services defined in the docker-compose.yml file located in the cloned repository.
The -d flag is used to run all the services in the background, allowing you to continue working in the same terminal window without being blocked by the running services.
Configuring N3uron
We provide a fully functional and “batteries included” N3uron configuration example that receives data via the OPC UA Client module and sends it to HiveMQ MQTT Broker using N3uron’s MQTT Client module.
Just load the N3uron configuration backup and we are ready to go.
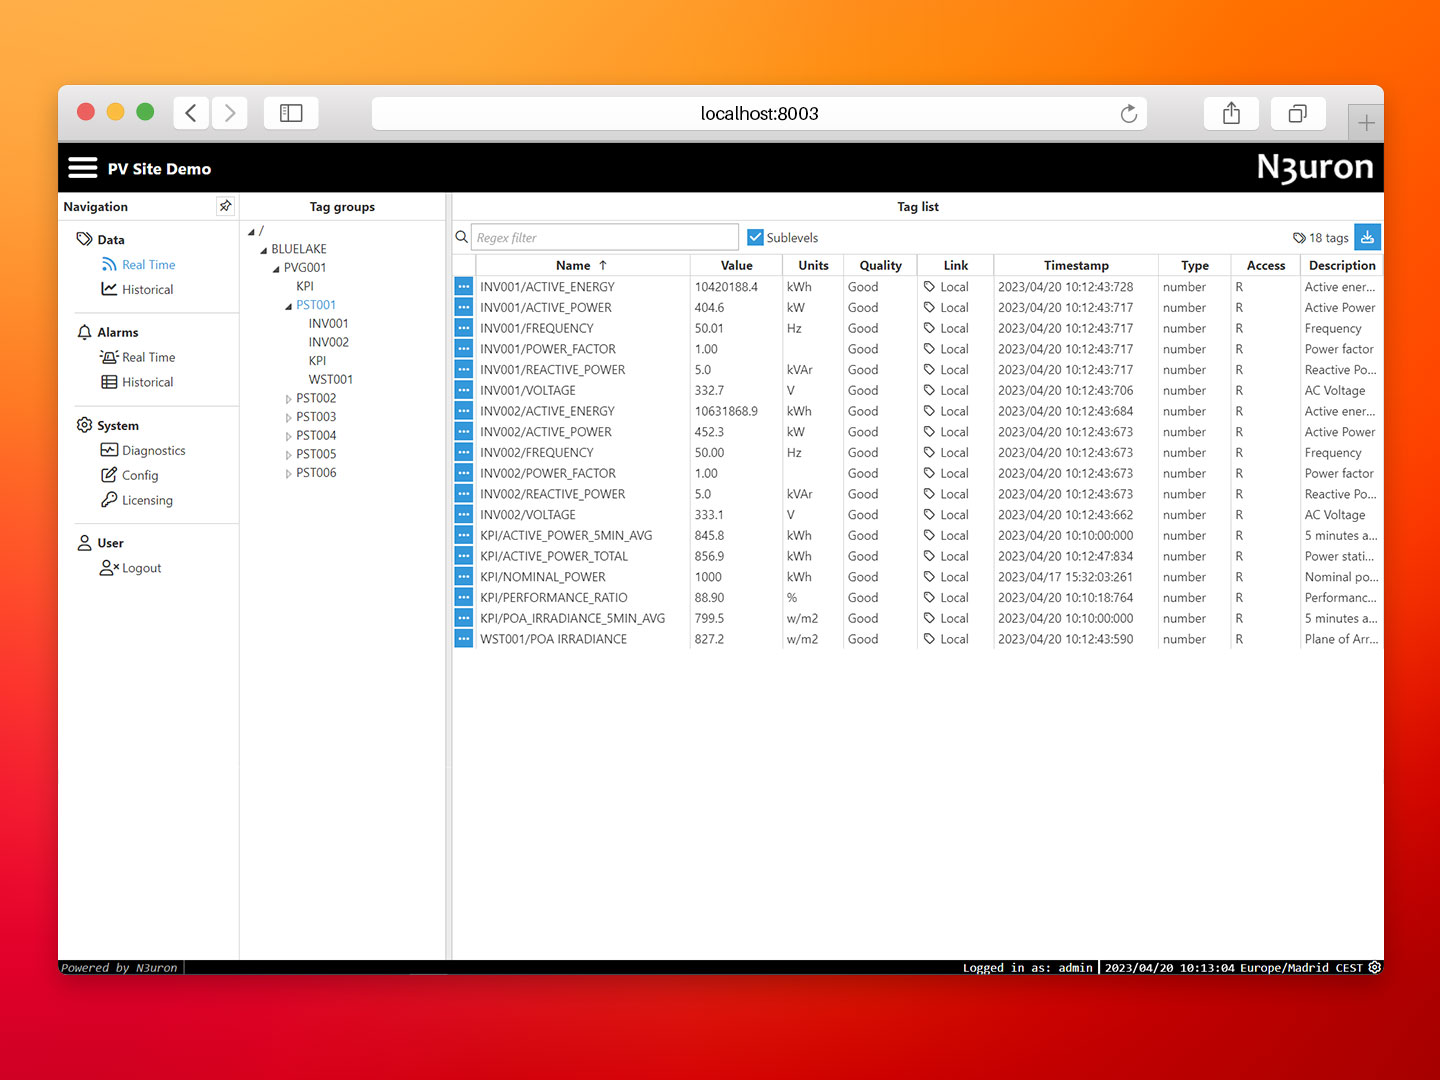
- Step 1: Open a web browser and go to http://localhost:8003/ to access the N3uron WebUI with default credentials:
- User: admin.
- Password: n3uron.
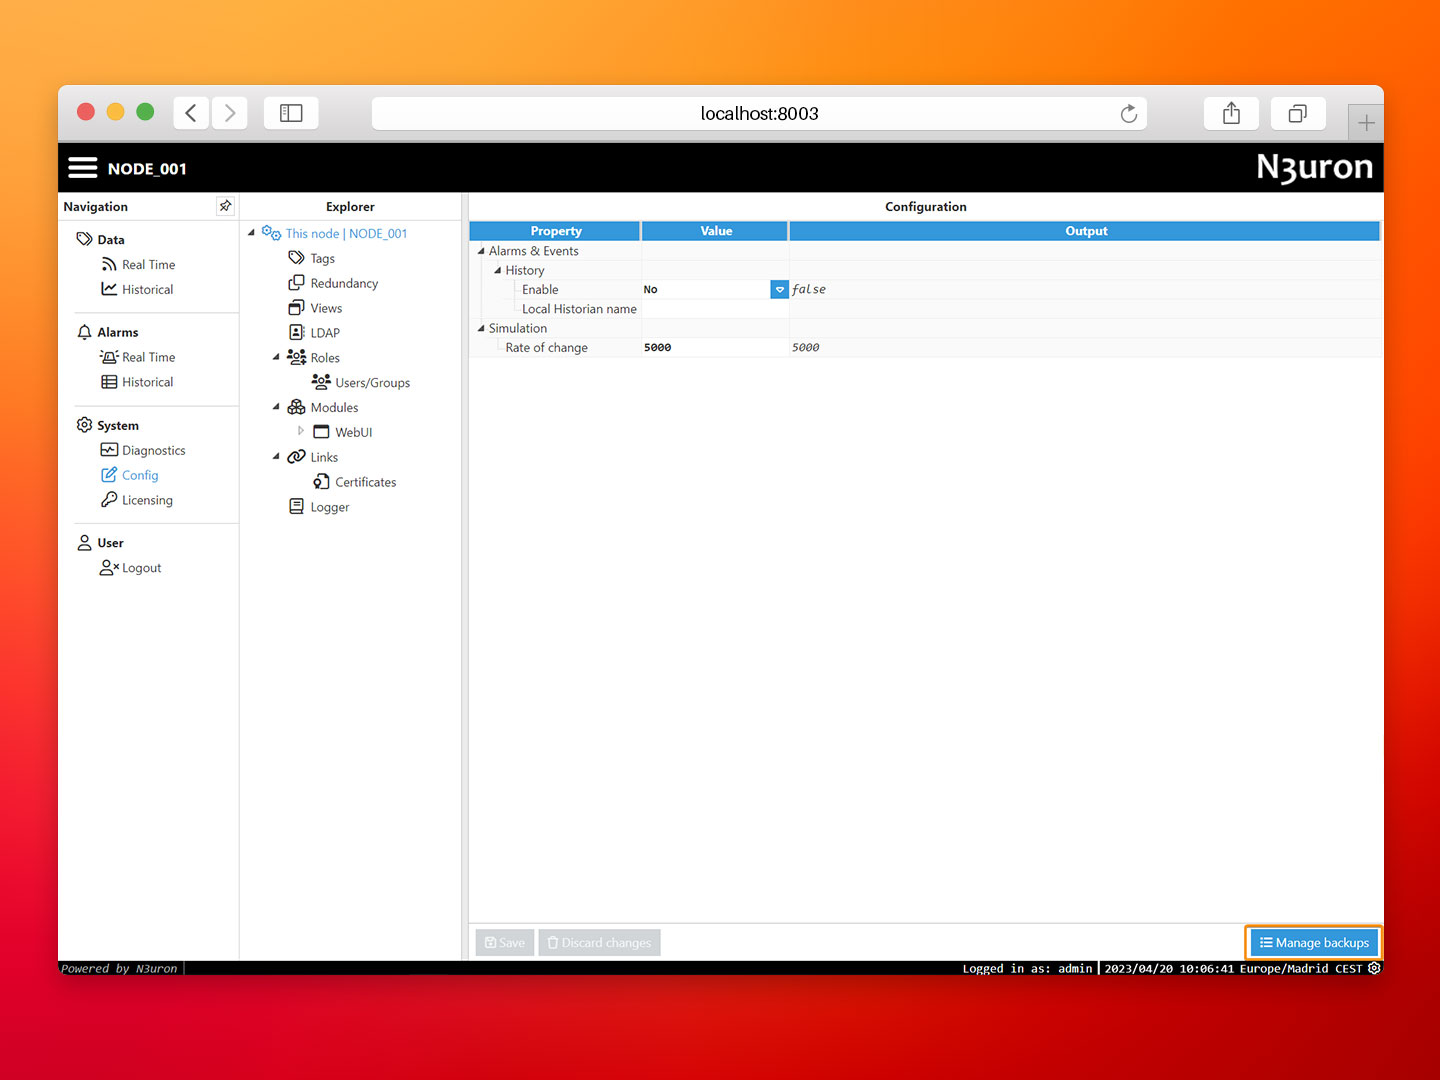
- Step 2: Navigate to the System→Config section and click on the Manage Backups button in the lower right corner.
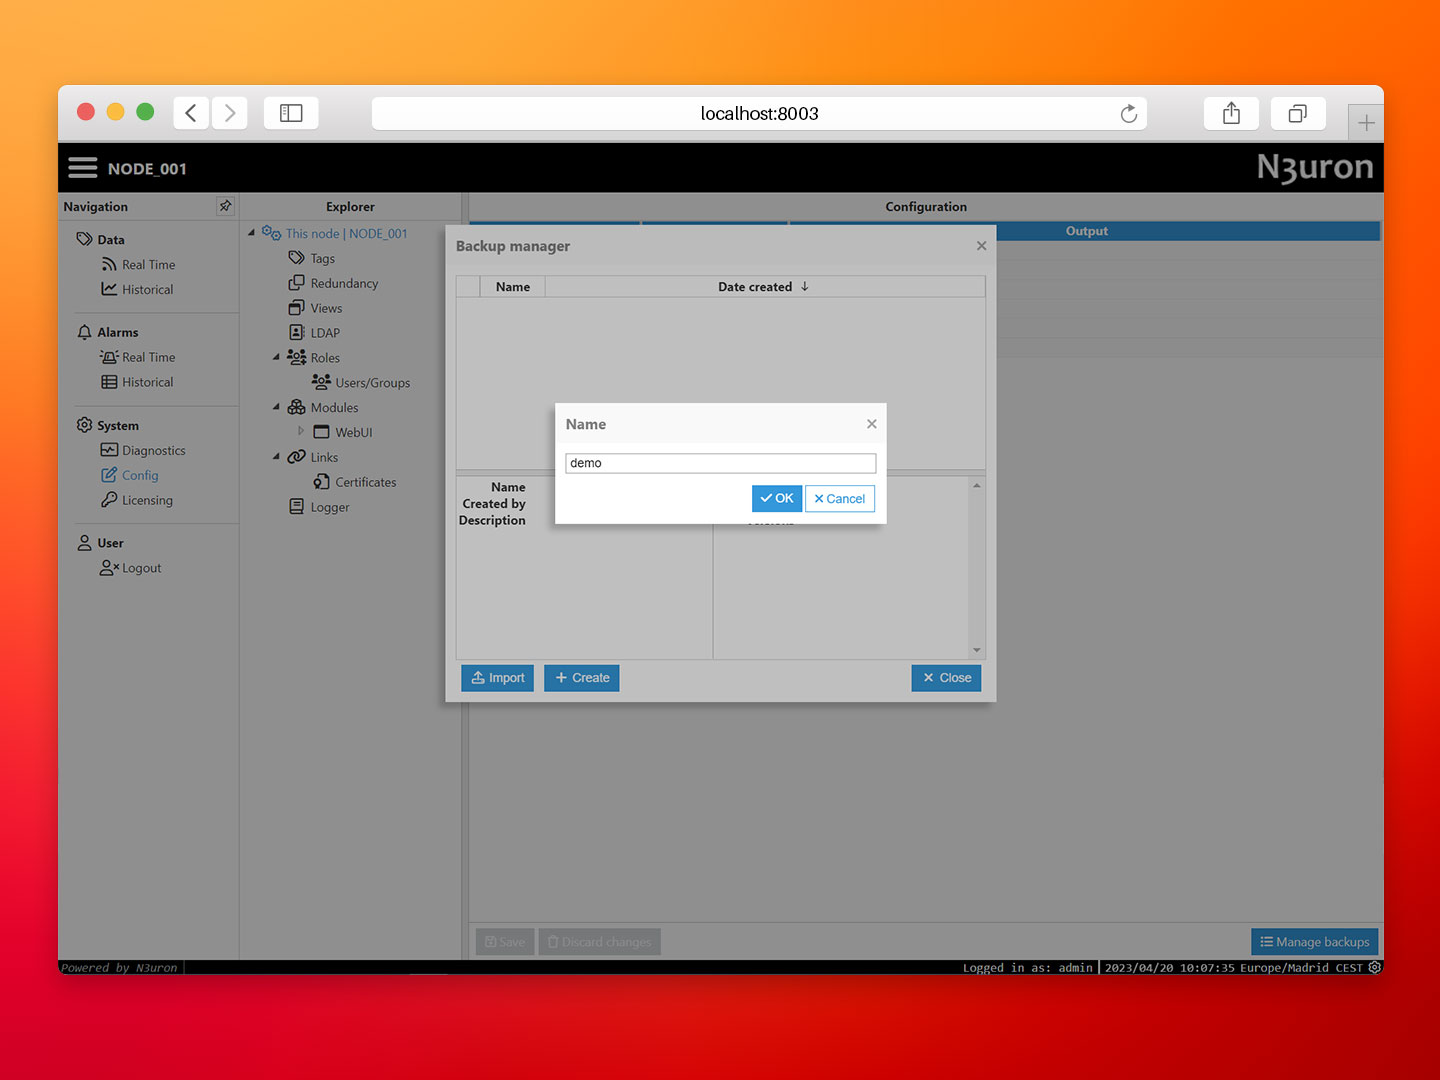
- Step 3: Import the backup file provided in the repository (demo.zip file).
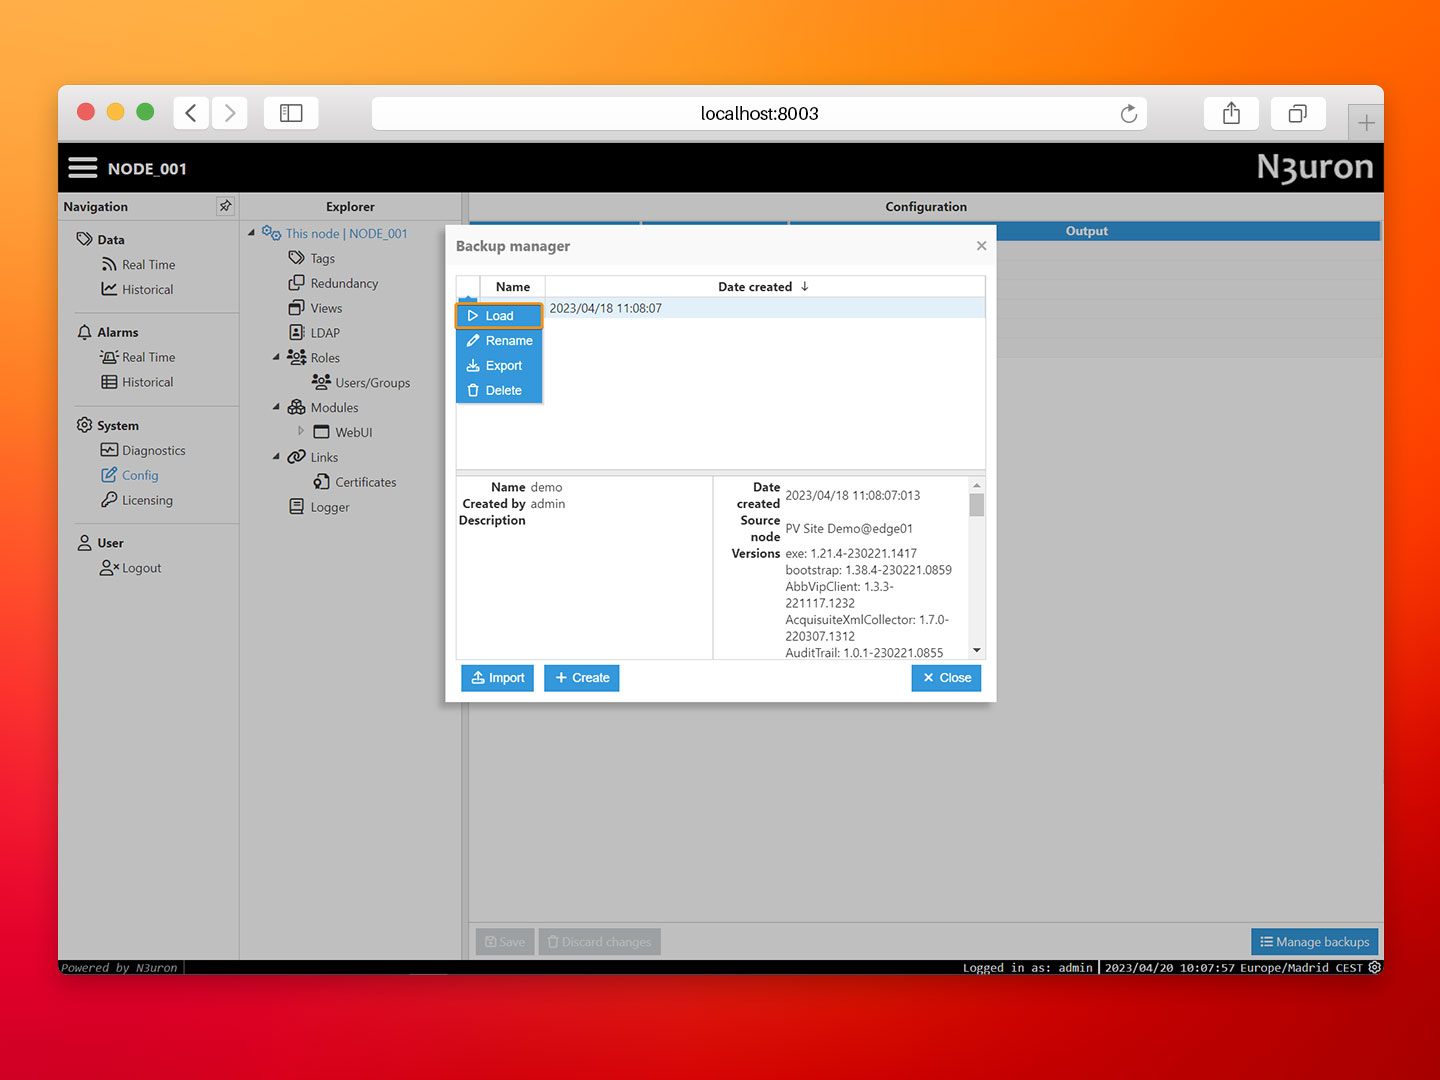
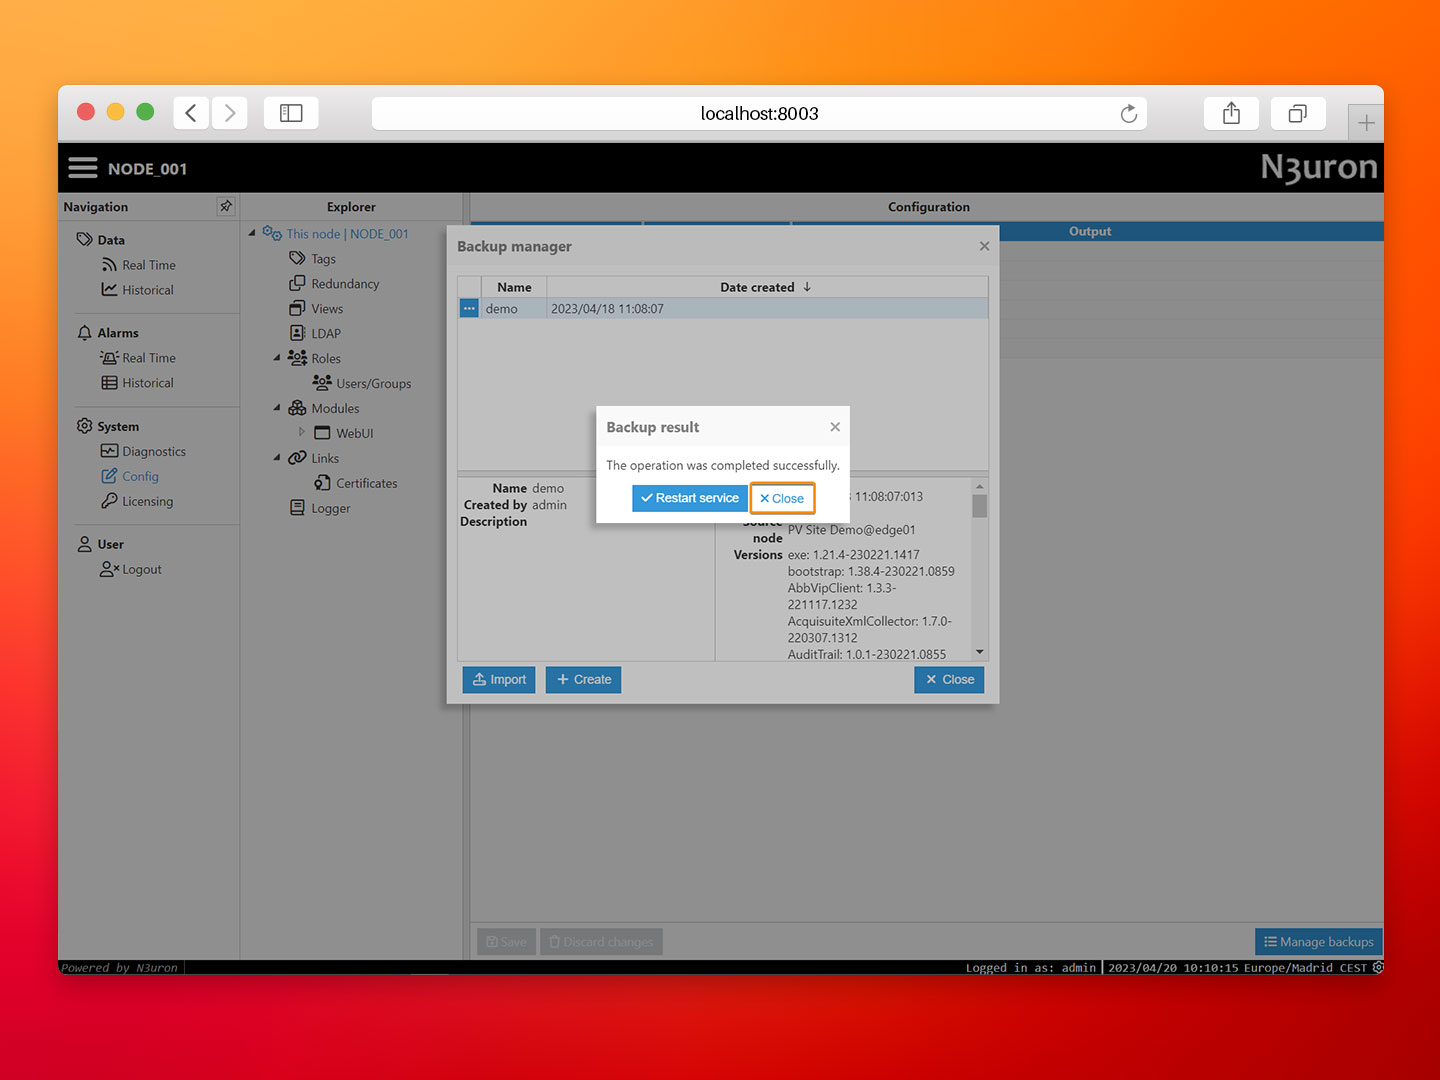
- Step 4: Proceed to load the backup. To do this, click on the ellipsis button on the left-hand side of the demo backup. Then, when asked to restart the service, select Close.
- Step 5: Restart the N3uron container by running the following command in the same terminal window where you launched Docker Compose:
docker compose restart n3uron
- Step 6: At this point, N3uron should be collecting the data corresponding to the photovoltaic plant through a remote OPC UA server. Return to the N3uron WebUI and verify that multiple tags have been created.
Configuring InfluxDB
Now we need to configure our InfluxDB database to ingest data from HiveMQ.
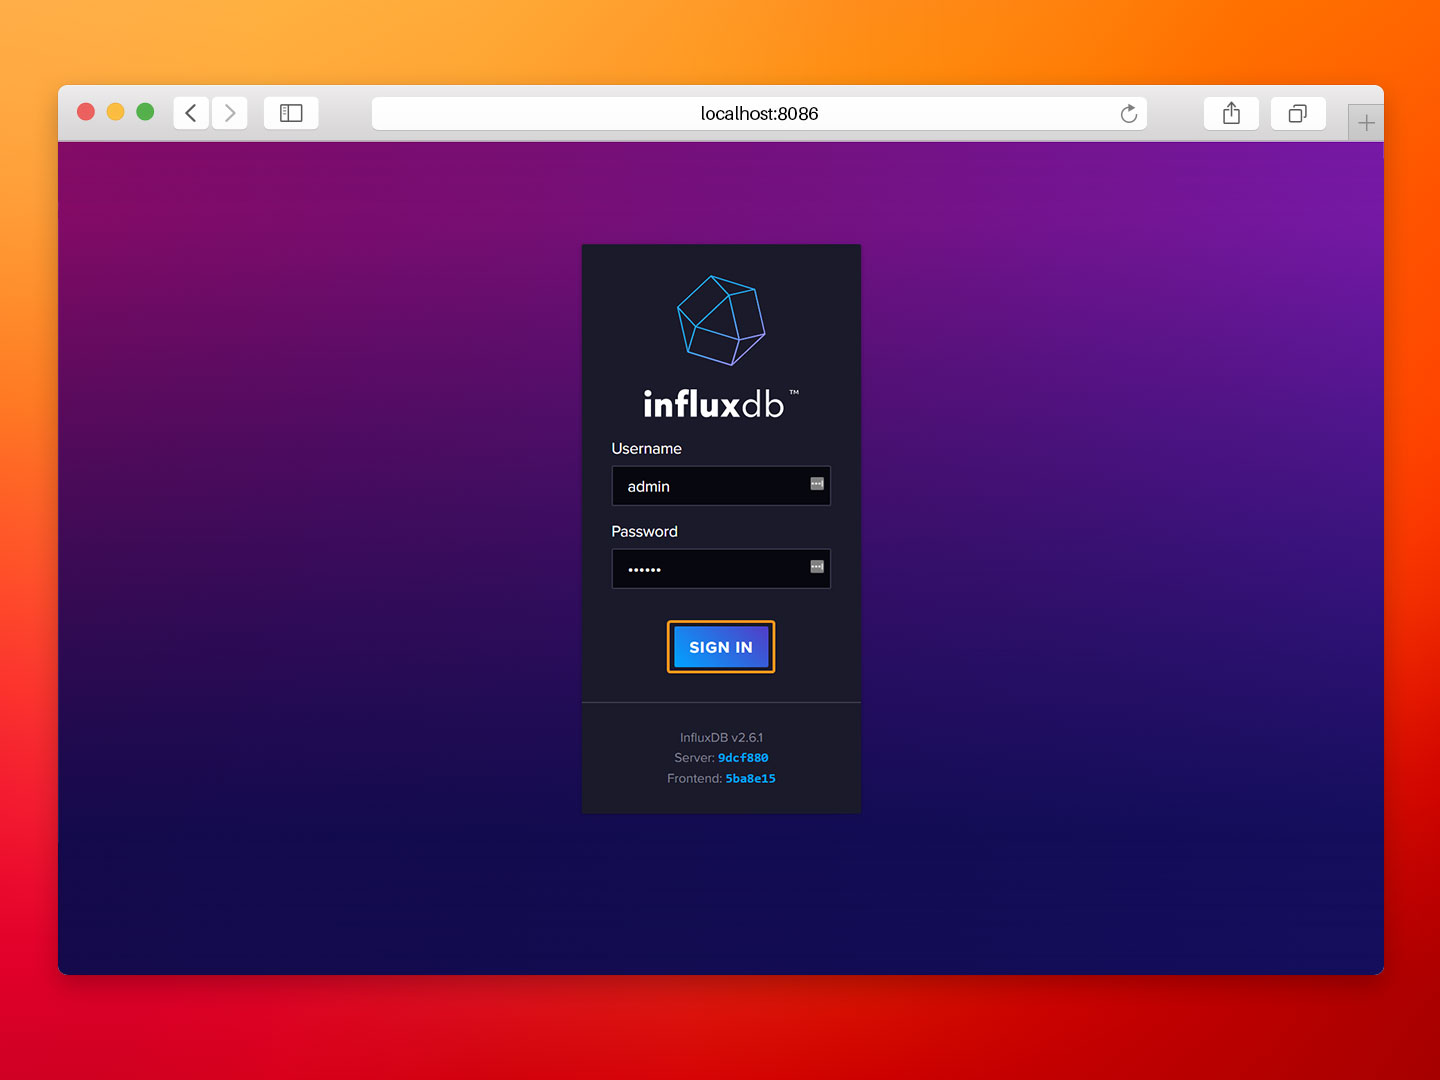
- Step 1: Open your web browser and go to http://localhost:8086/ to access the InfluxDB UI. Then, log in with the credentials:
- User: admin.
- Password: n3urondemo.
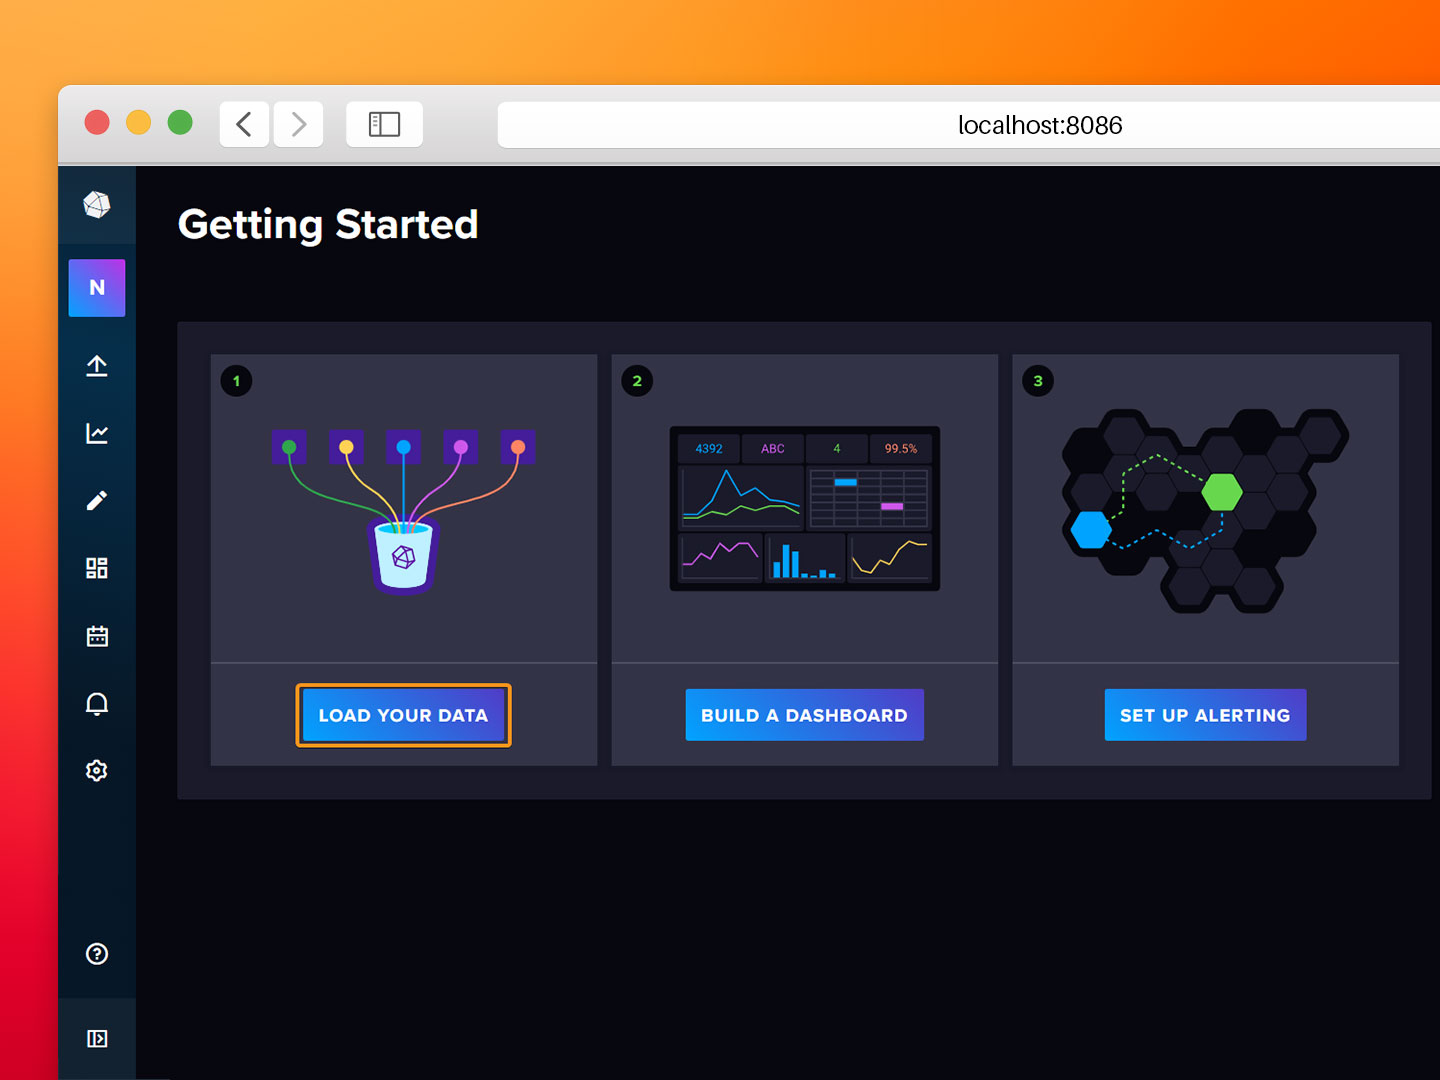
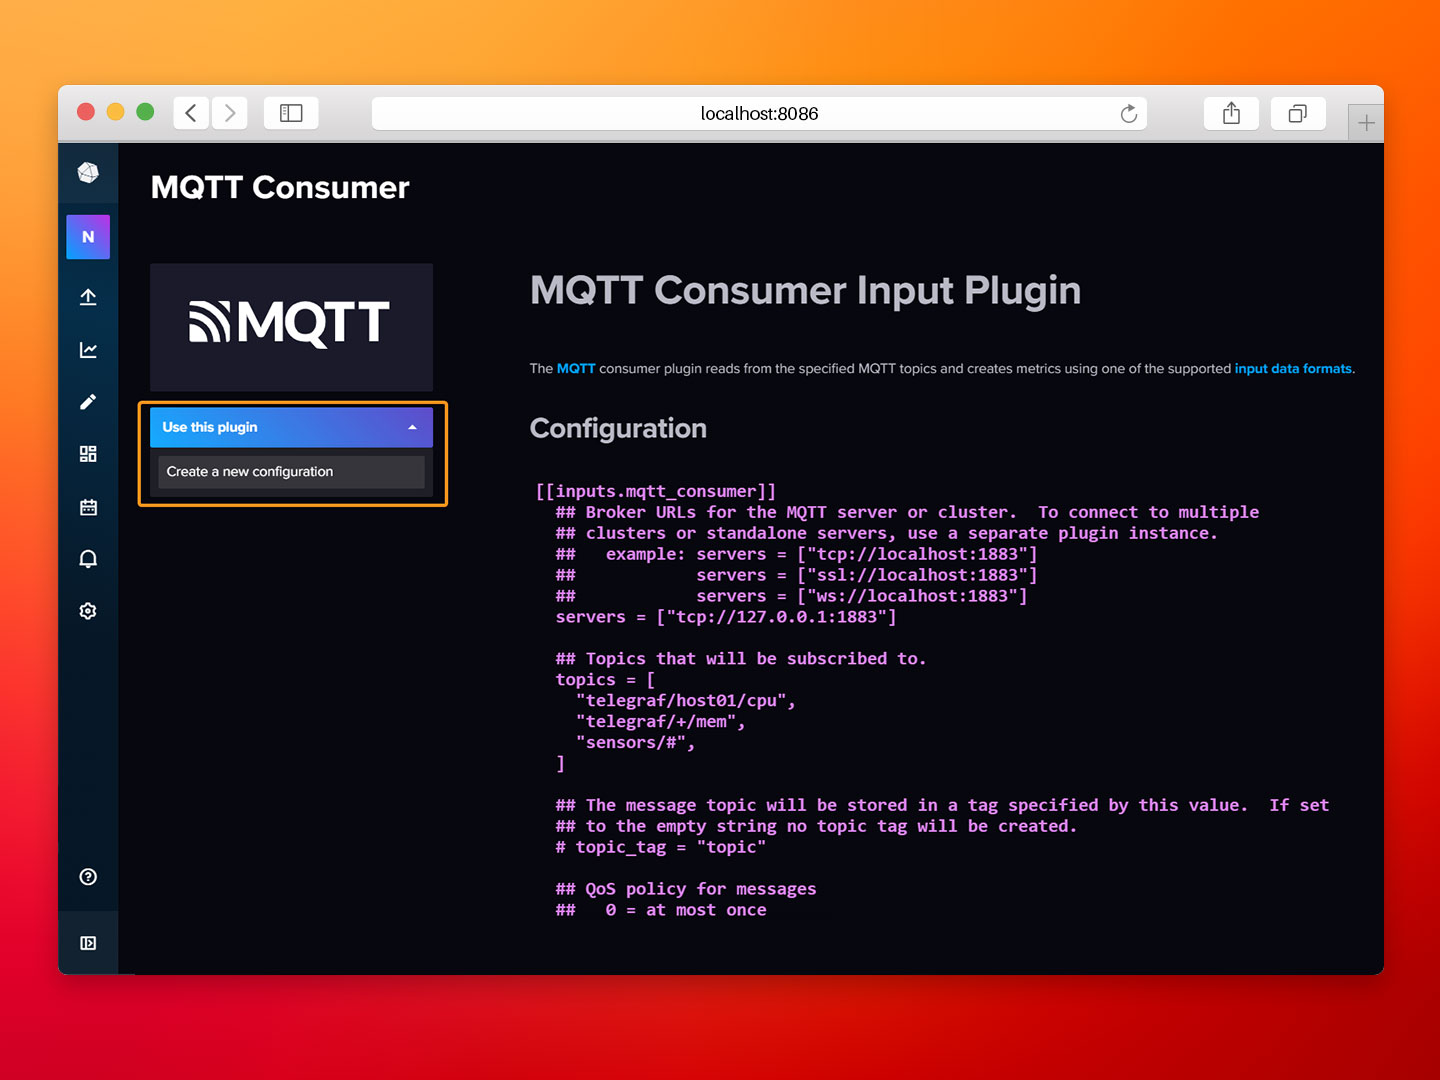
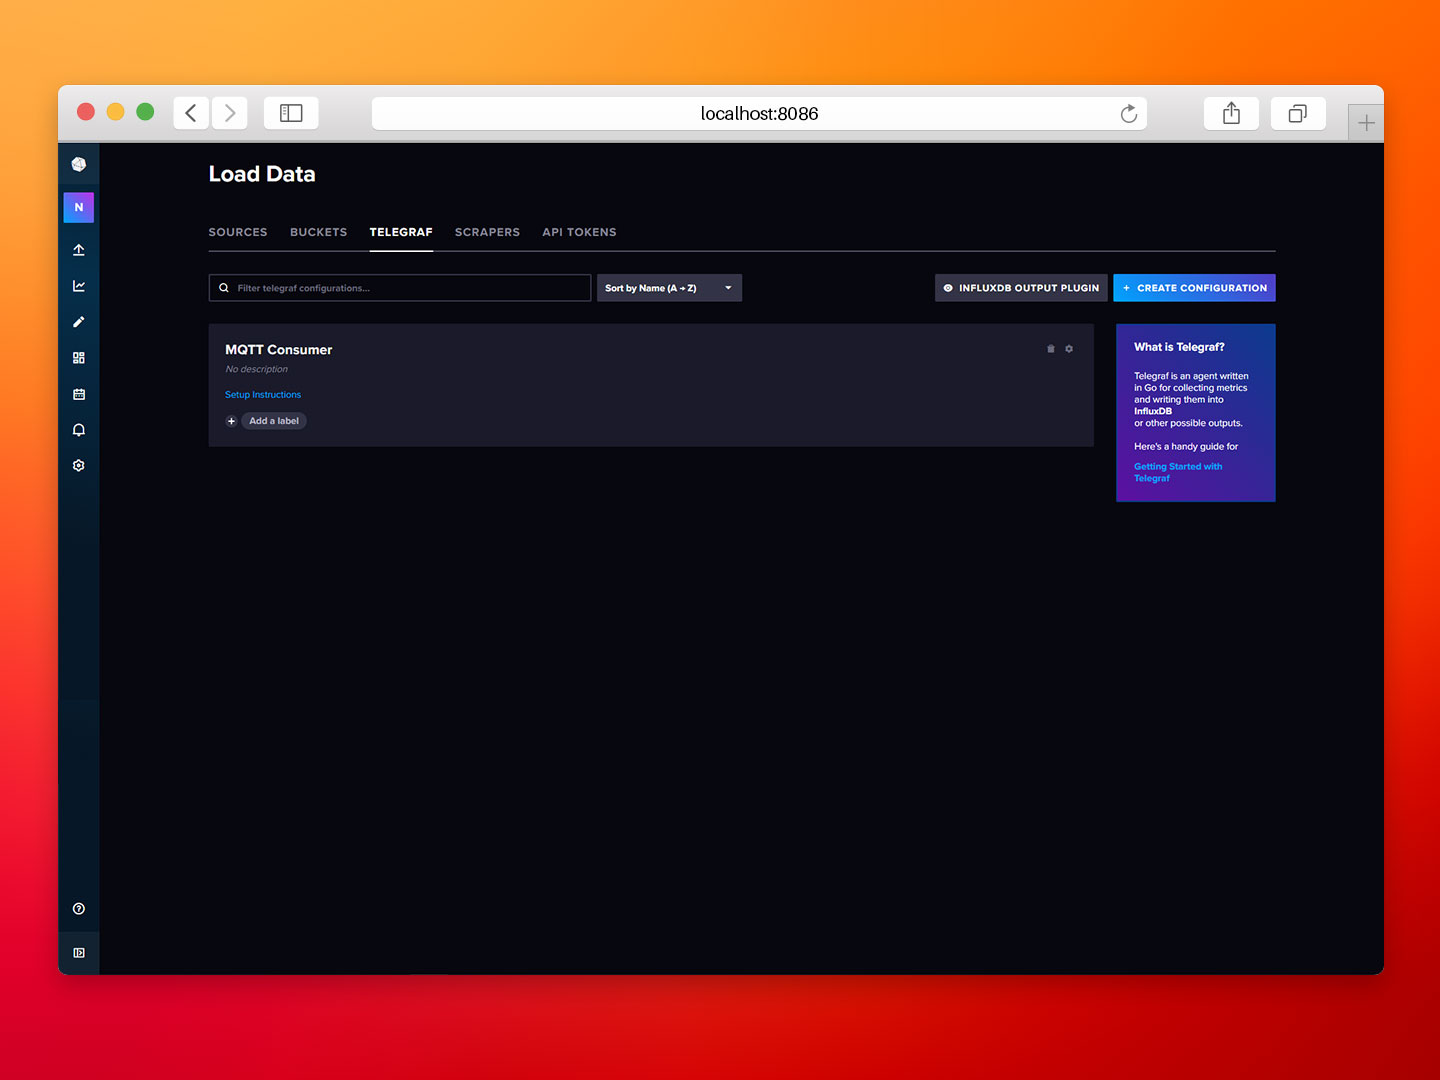
- Step 2: Select Load your data and search for the MQTT Consumer module.
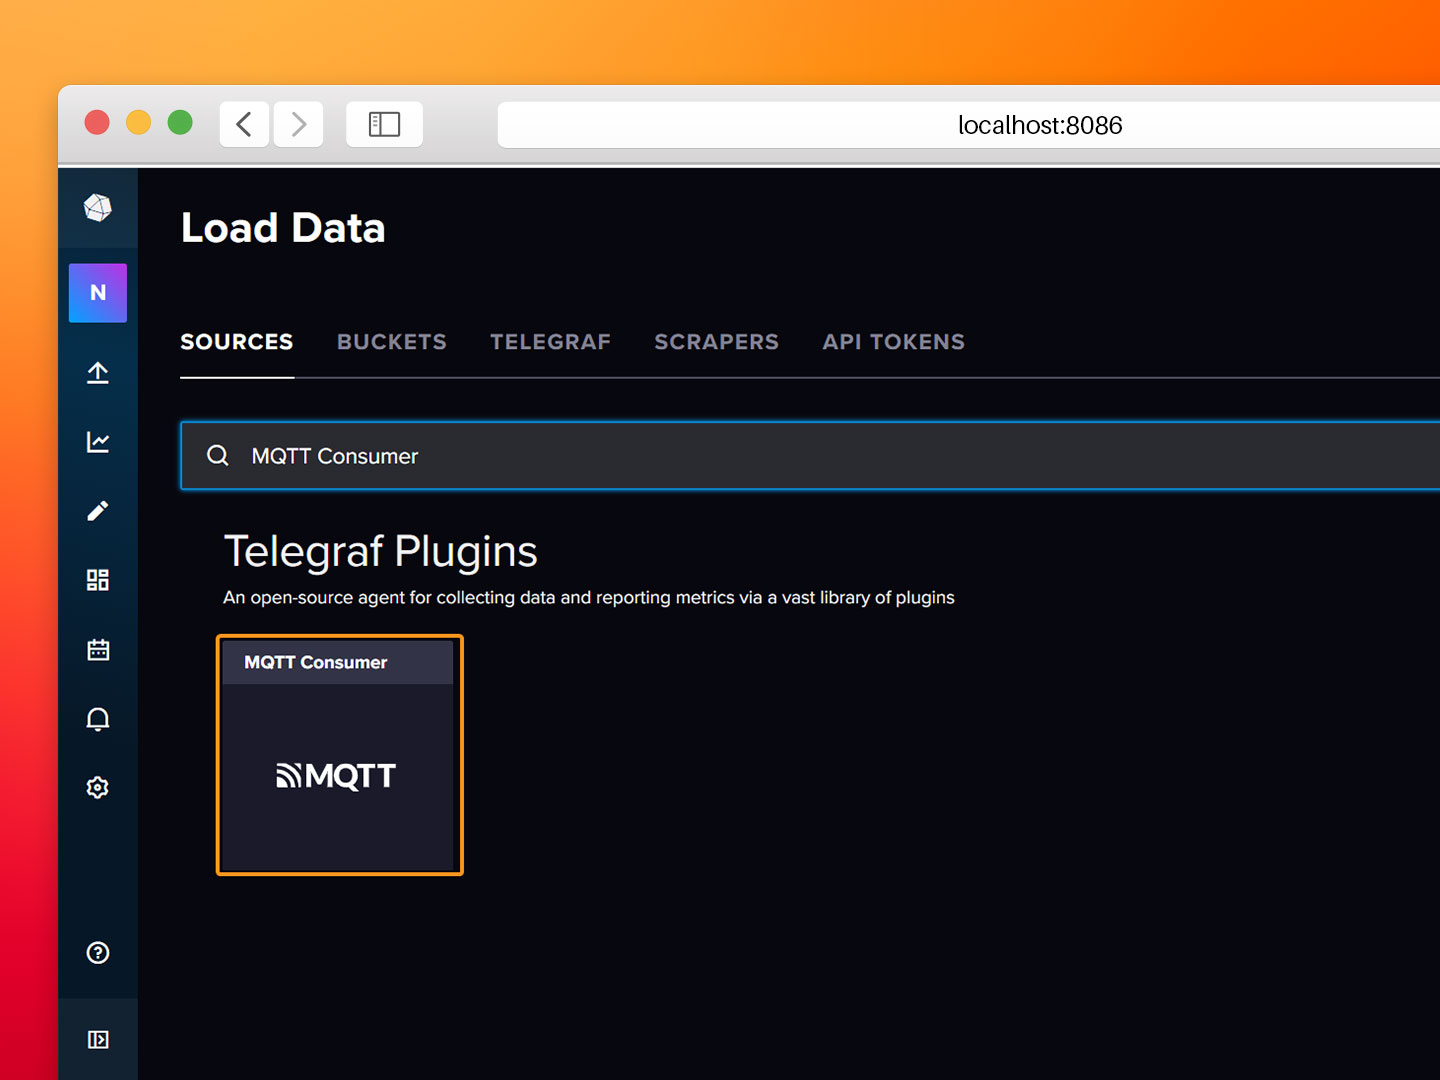
- Step 3: Click on Use this plugin and after that, on Create a new configuration.
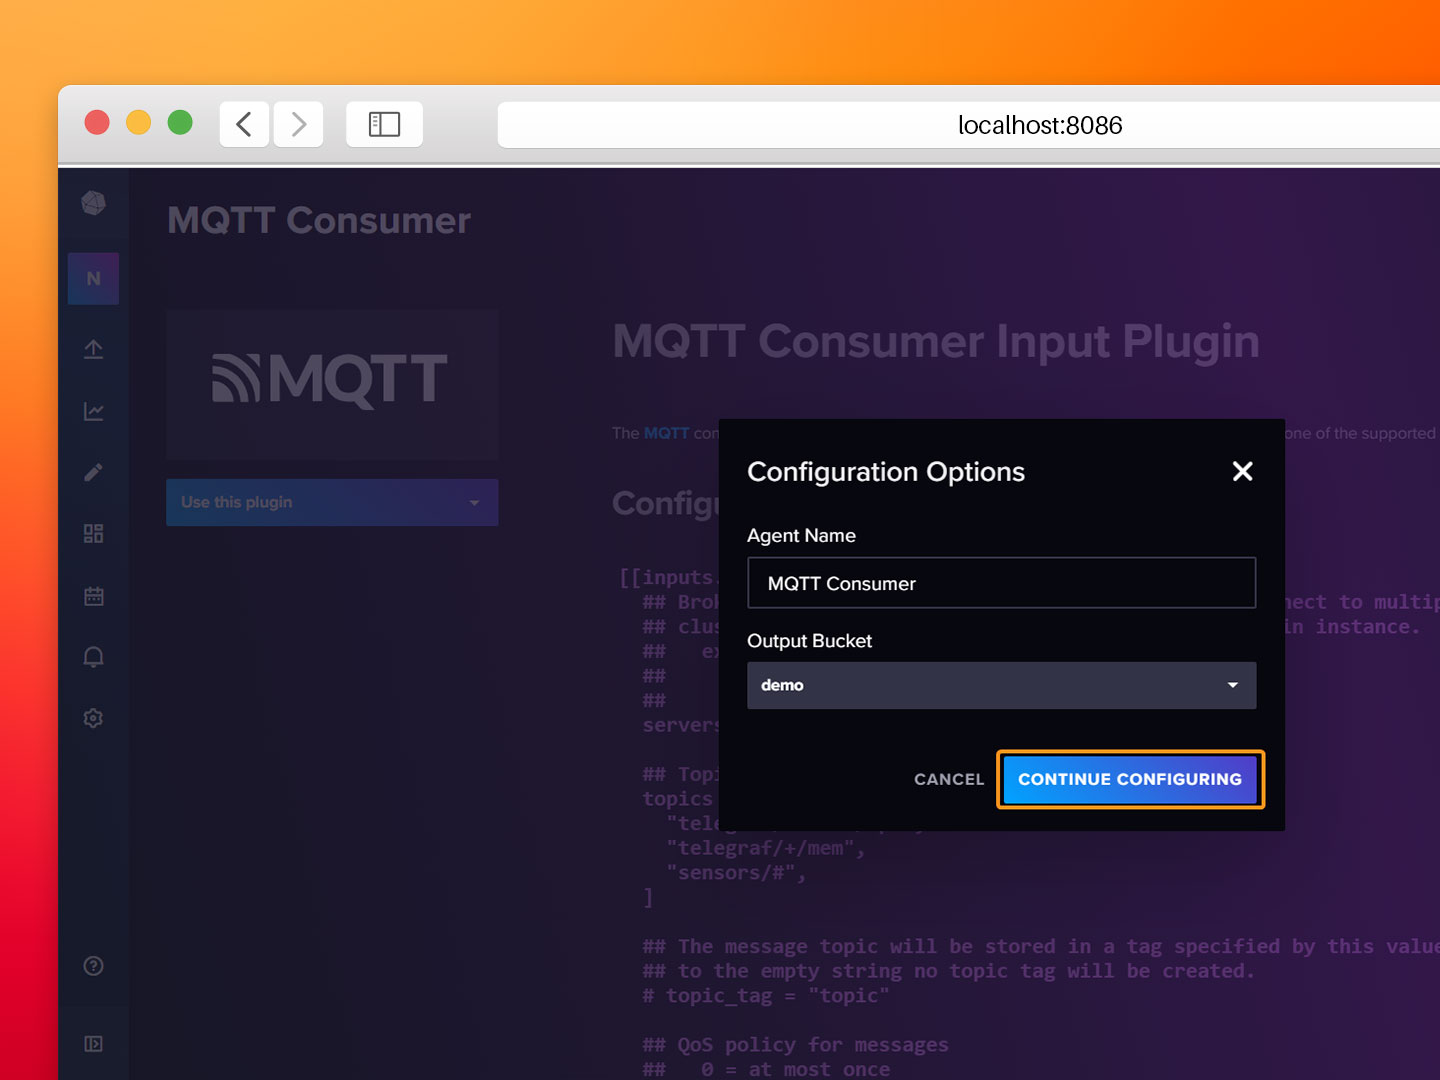
- Step 4: Select the demo bucket that already exists in the Output Bucket field and click on Continue Configuring.
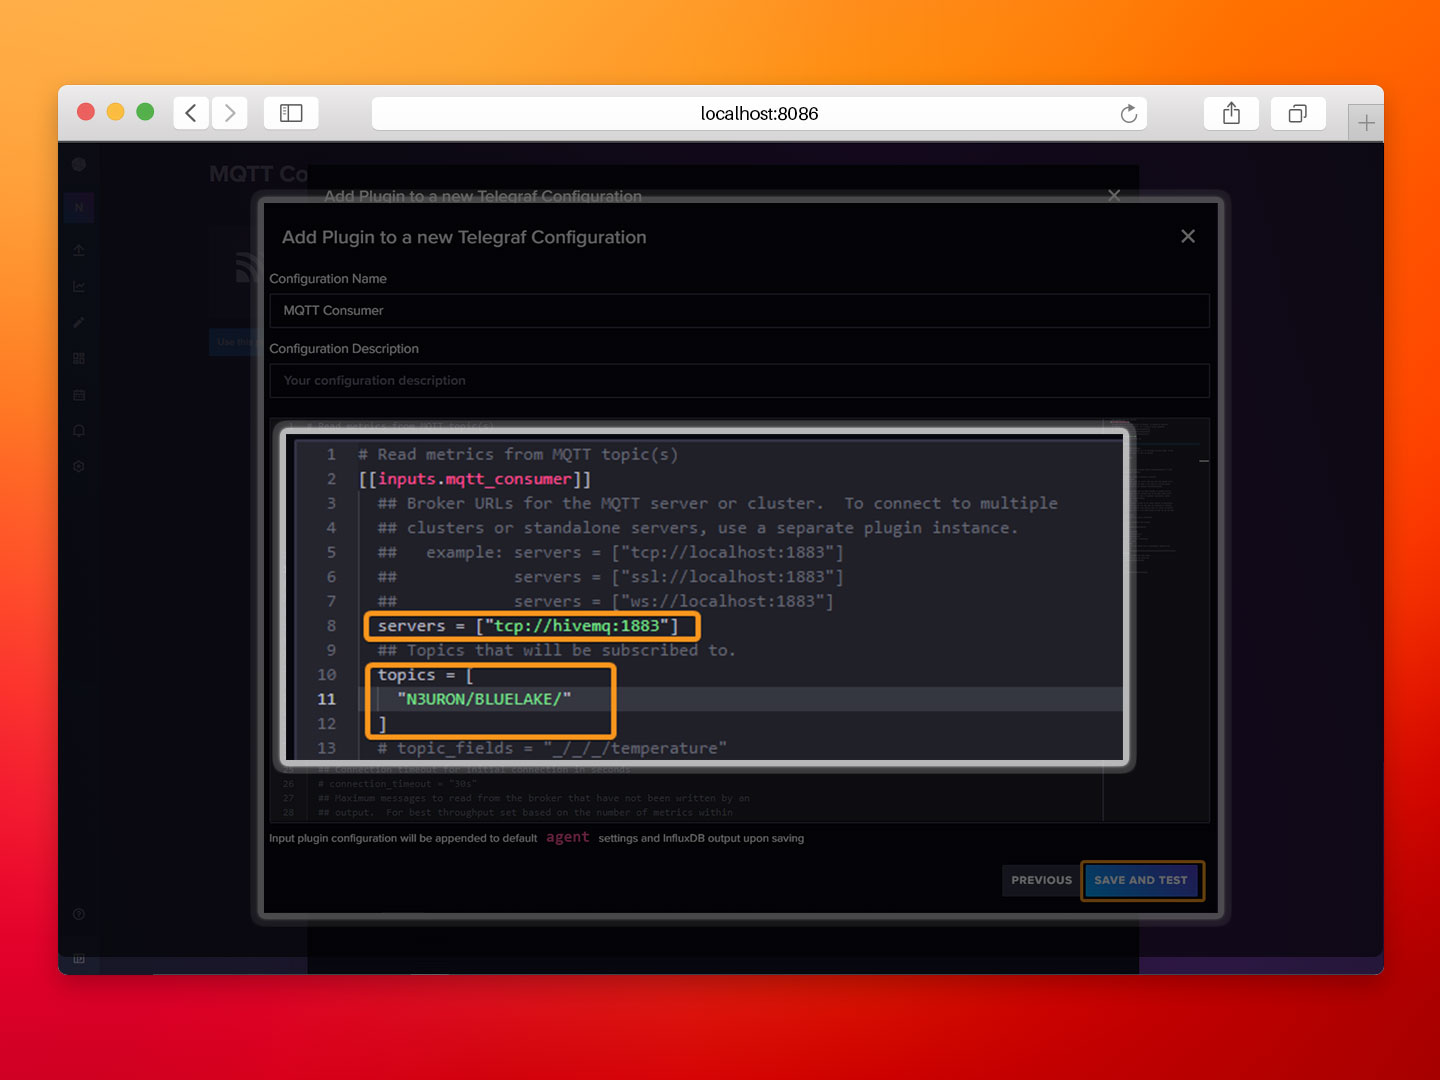
- Step 5: Set tcp://hivemq:1883 as the server endpoint, subscribe to the "N3URON/BLUELAKE/" MQTT topic, and click Save and Test.
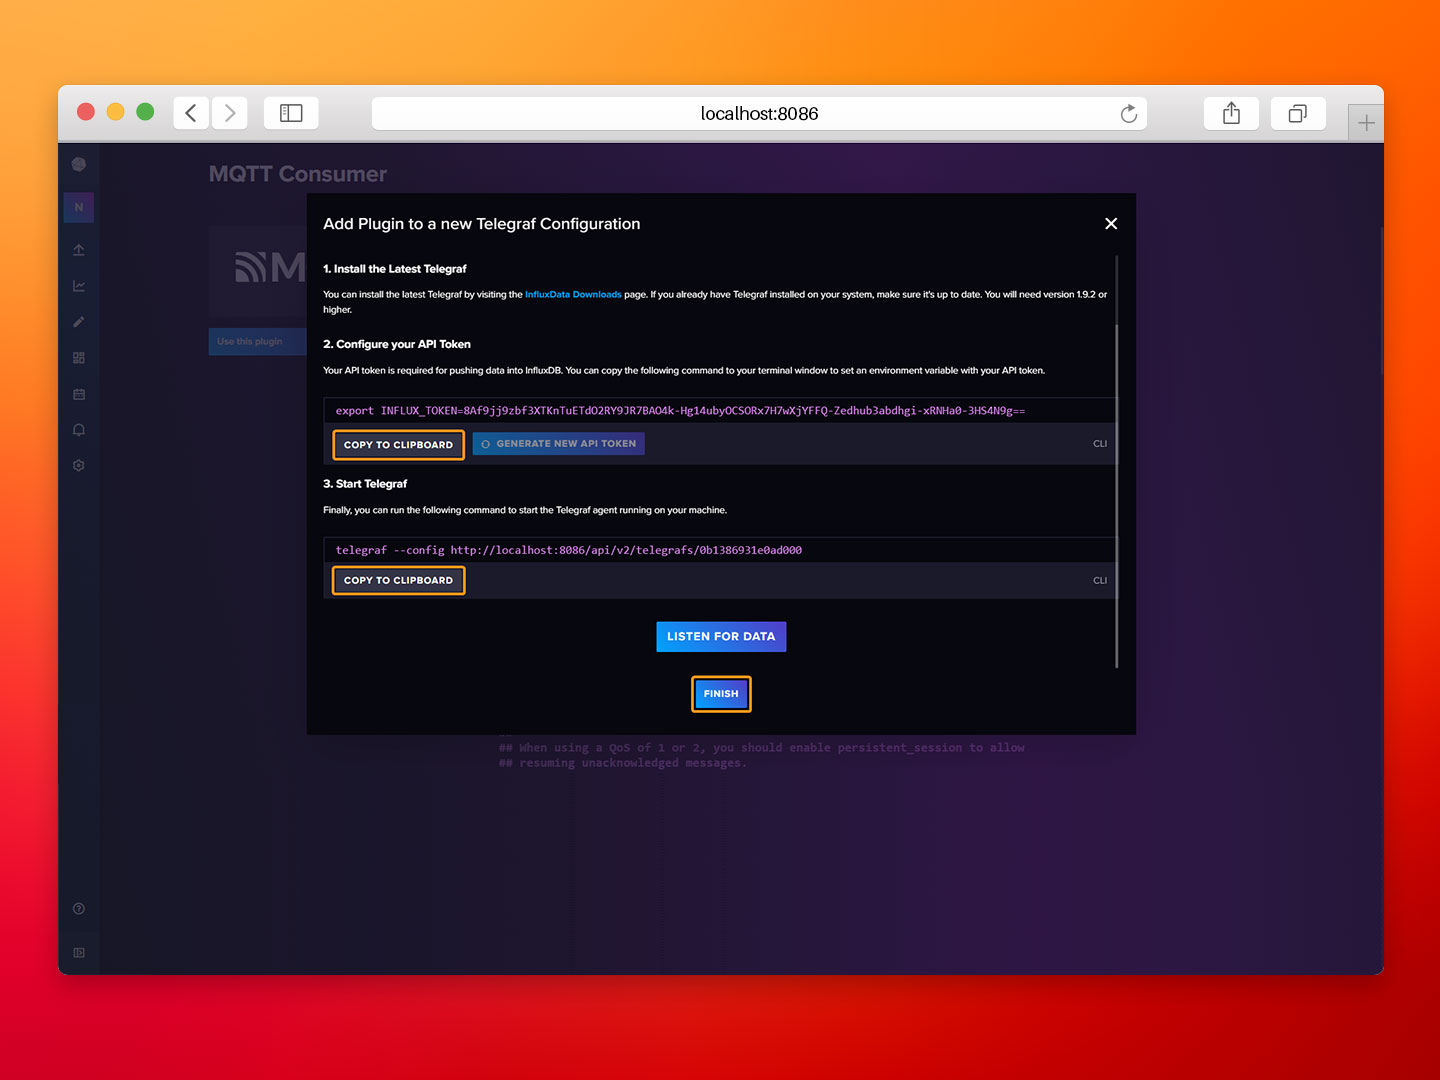
- Step 6: Copy the API Token and URL, we’ll need them for the next section. Then click Finish to complete the configuration process.
Configure the Telegraf agent
InfluxDB relies on its Telegraf agent to collect metrics from MQTT topics and insert them into the storage engine. We are going to launch Telegraf as a container in our stack.
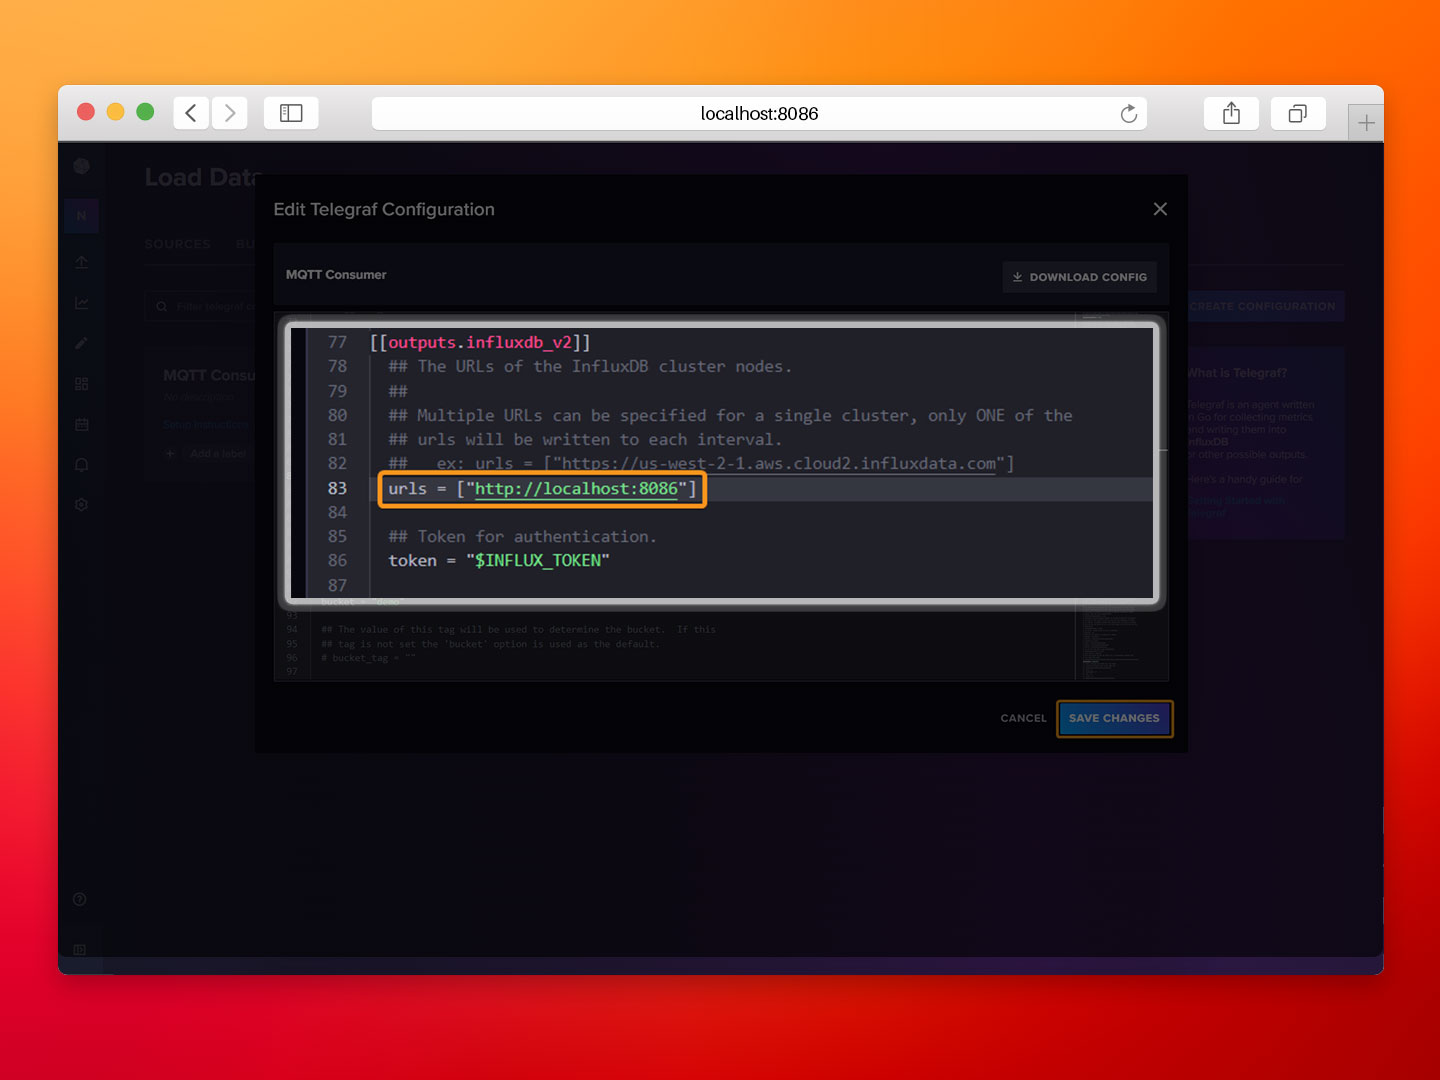
- Step 1: In the InfluxDB UI select the TELEGRAF tab and click on MQTT Consumer.
- Step 2: Scroll down to outputs.influxdb_v2 and set urls to http://influx:8086, then click Save Changes.
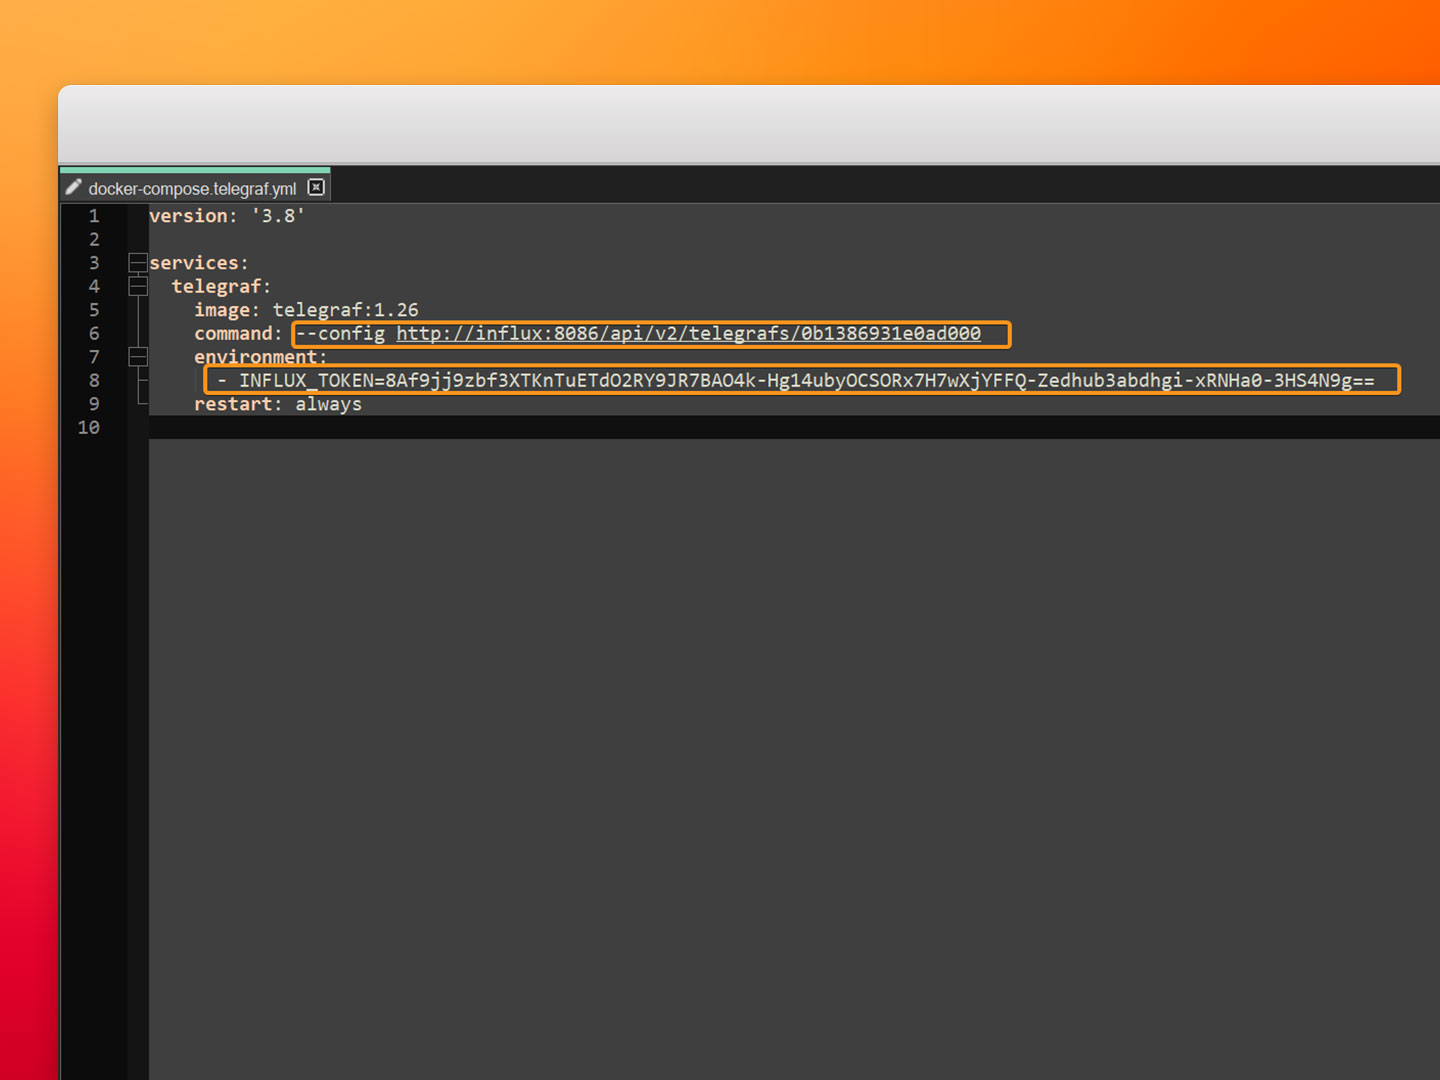
- Step 3: Edit the docker-compose.telegraf.yml file, complete the URL and set the INFLUX_TOKEN environment variable to the values provided by InfluxDB in the previous section. Save the changes to the docker-compose.telegraf.yml file.
- Step 4: Run Docker Compose to launch the new service.
docker compose -f docker-compose.yml -f docker-compose.telegraf.yml up -d
- Step 5: Navigate to the BUCKETS tab and select the demo bucket.
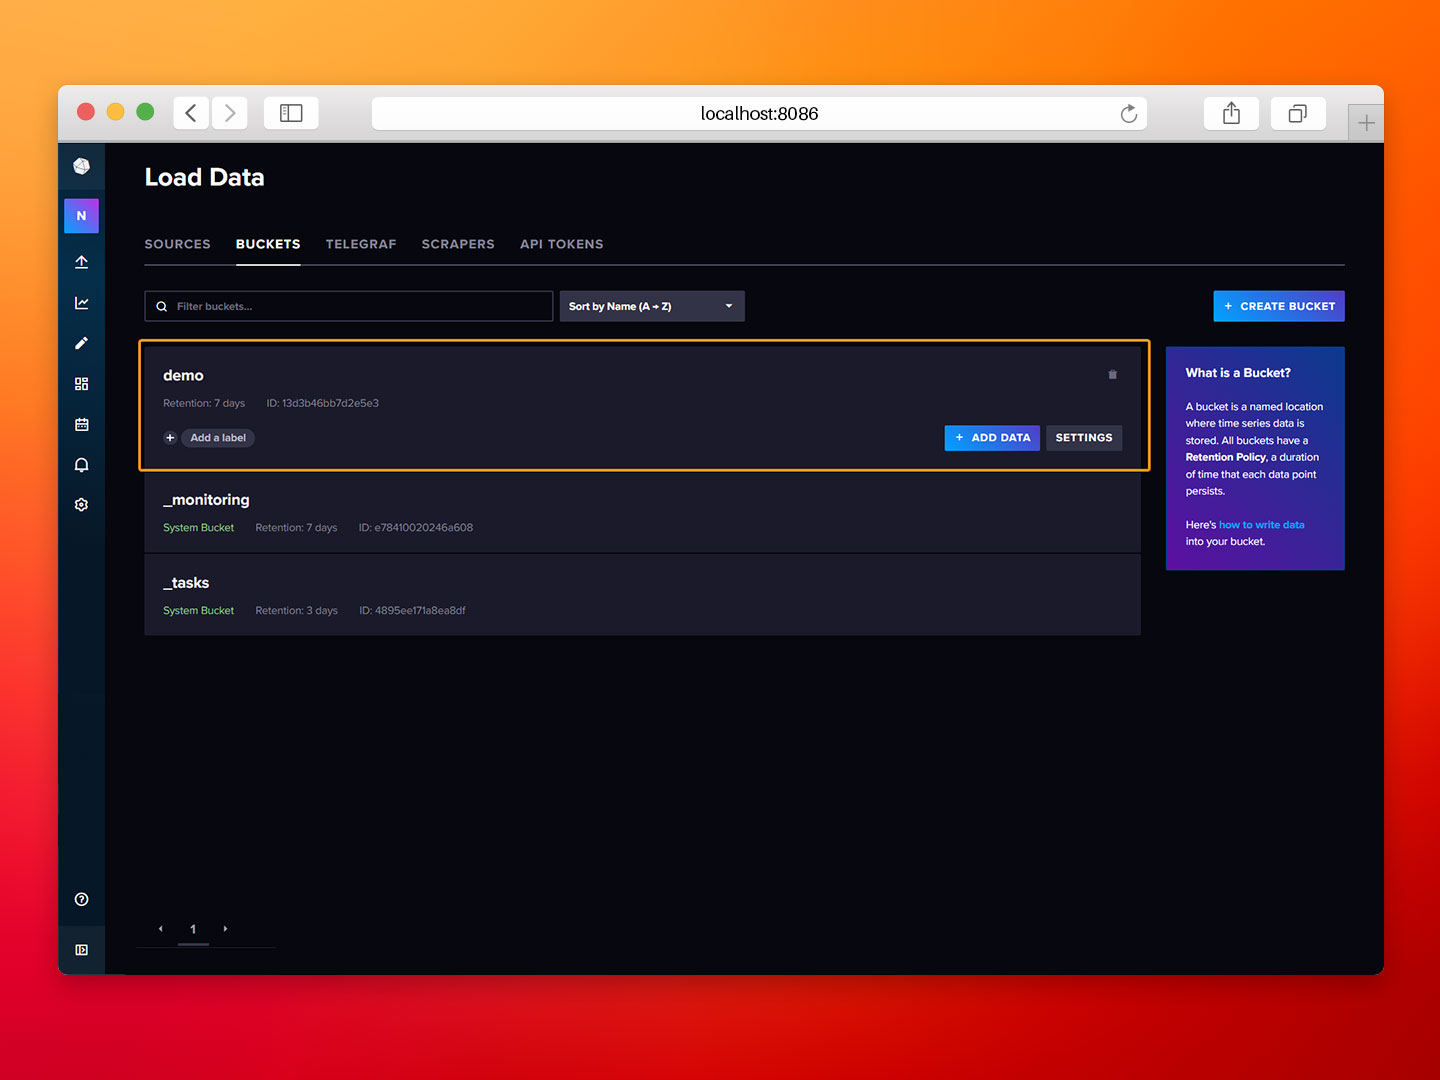
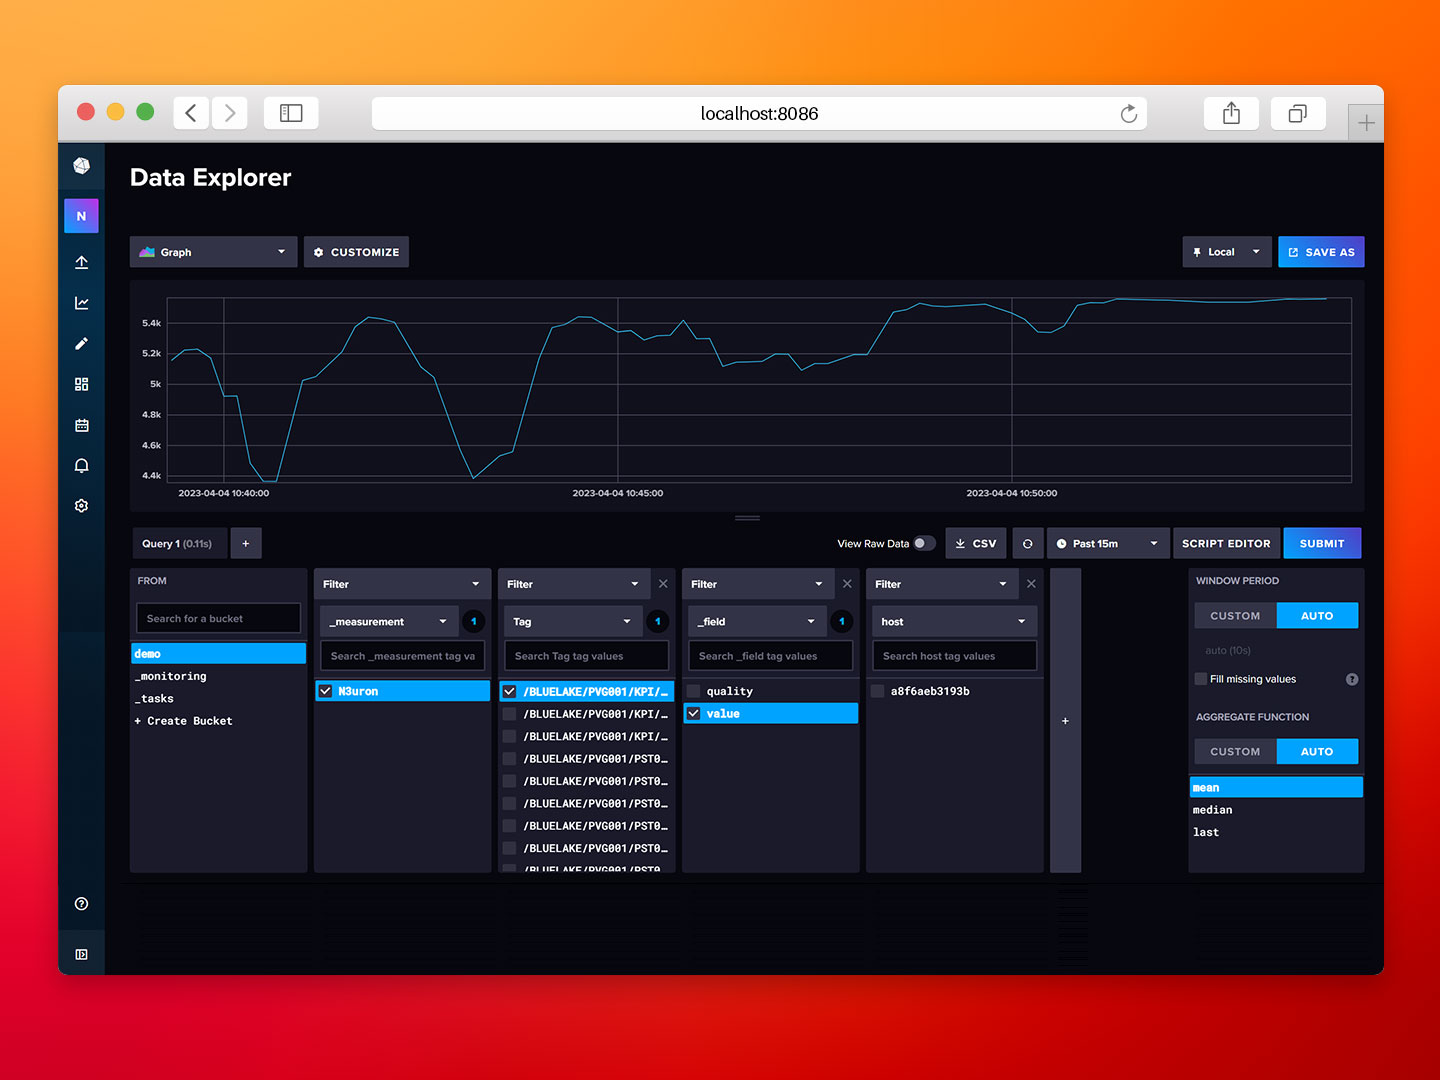
- Step 6: Wait for a few minutes and use the Data Explorer to verify that the data from the HiveMQ MQTT Broker is flowing into our InfluxDB database.
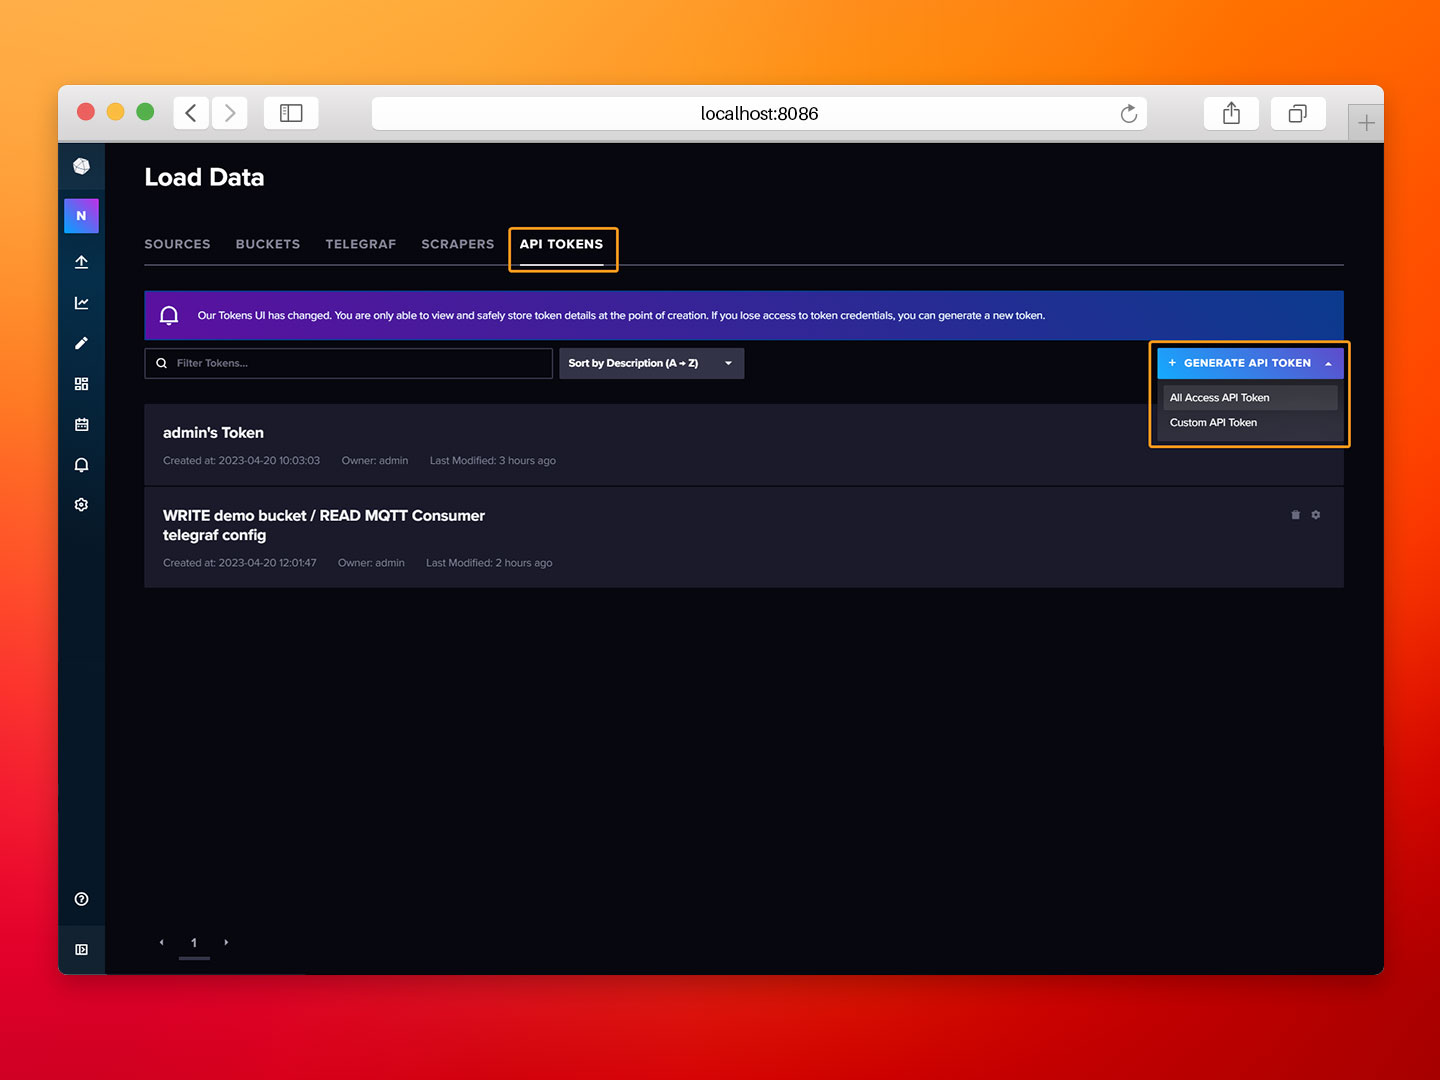
Generate an API Token for Grafana
Grafana uses an API Token to authenticate to InfluxDB and query data, so we need to generate a token in the InfluxDB UI.
- Step 1: Go to the API TOKENS tab, click on Generate API Token, and select All Access API Token.
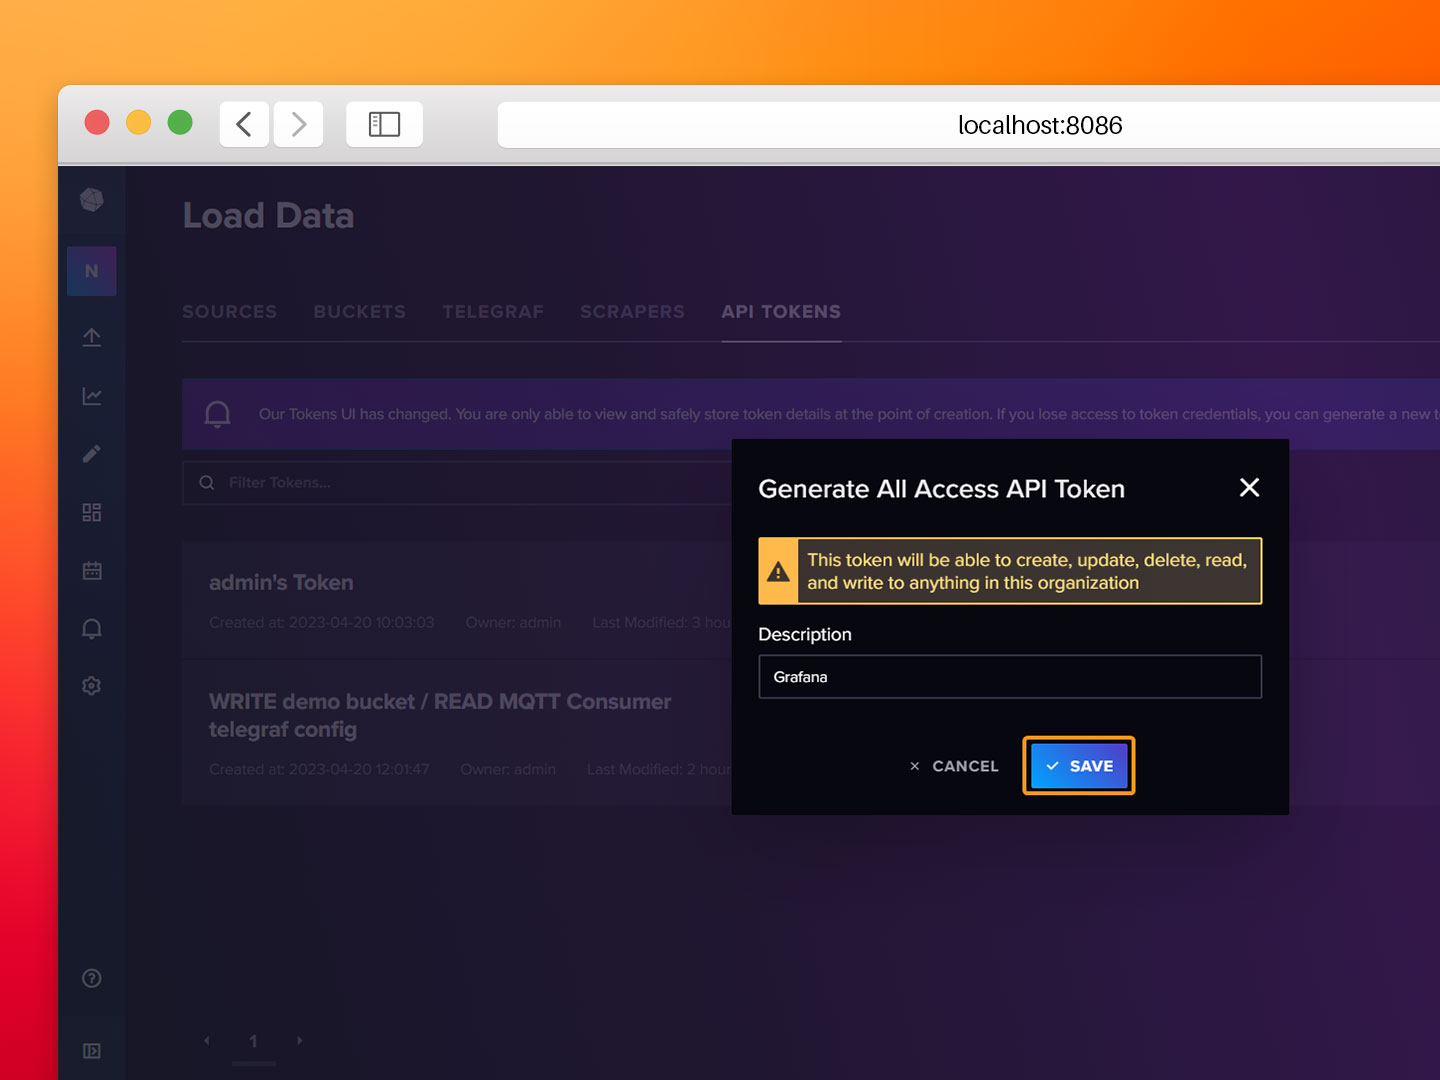
- Step 2: Provide a description for the token and click on Save.
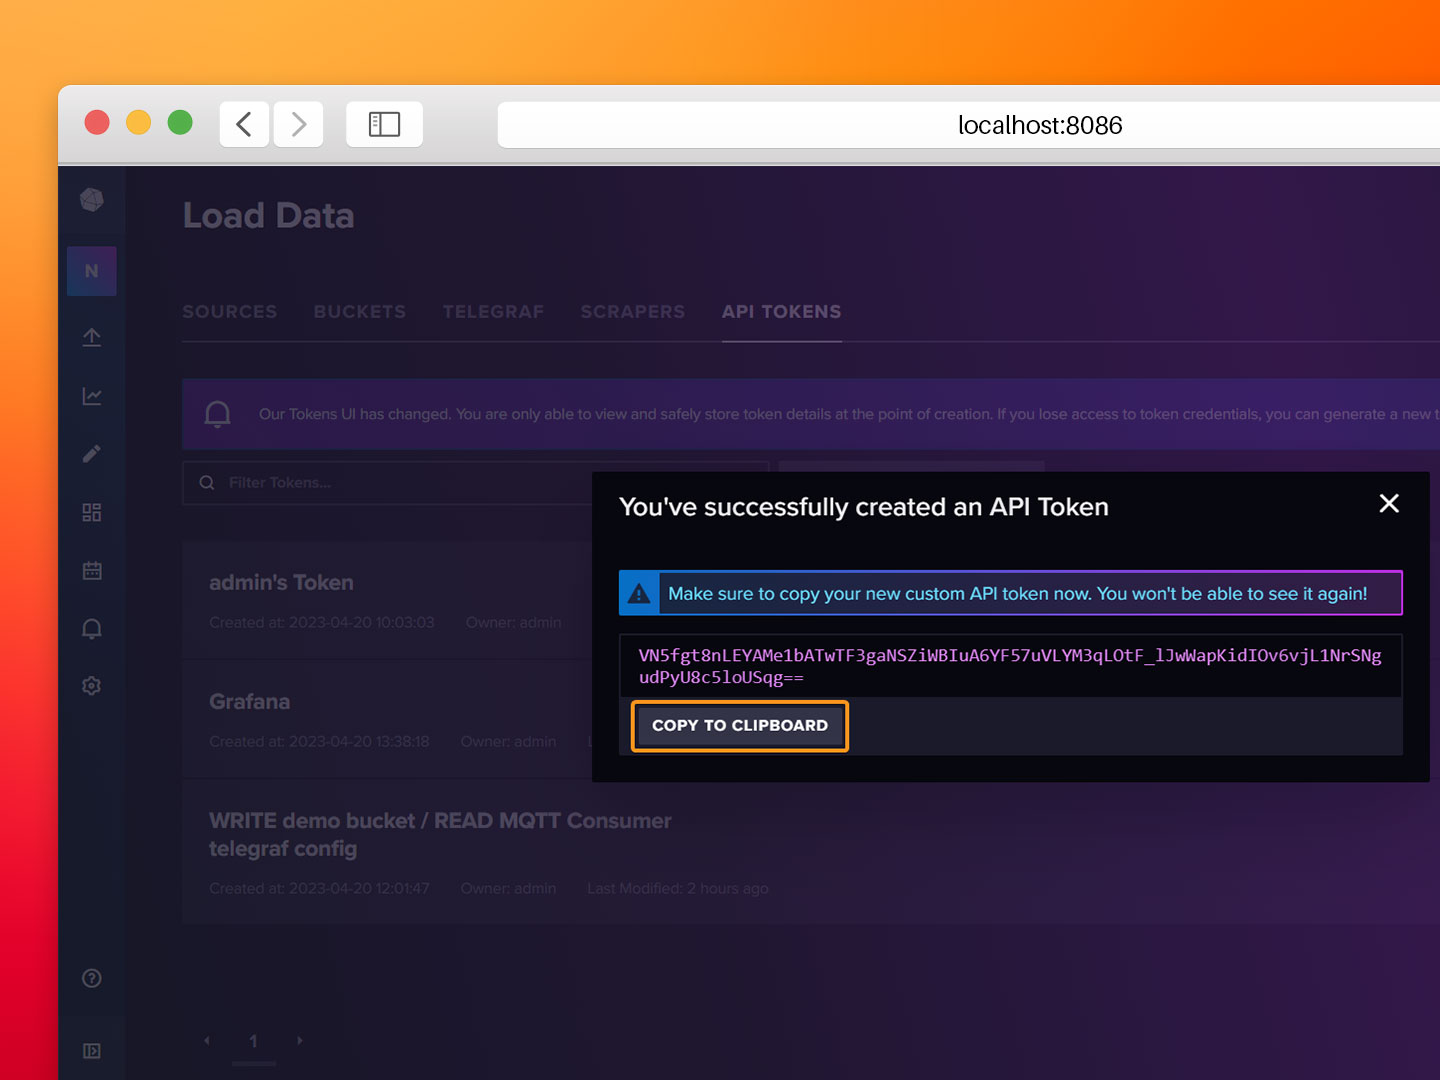
- Step 3: Copy the generated token and save it for the next section.
Configuring Grafana
Finally, to visualize the data we need to set up Grafana reading from InfluxDB as its Data Source.
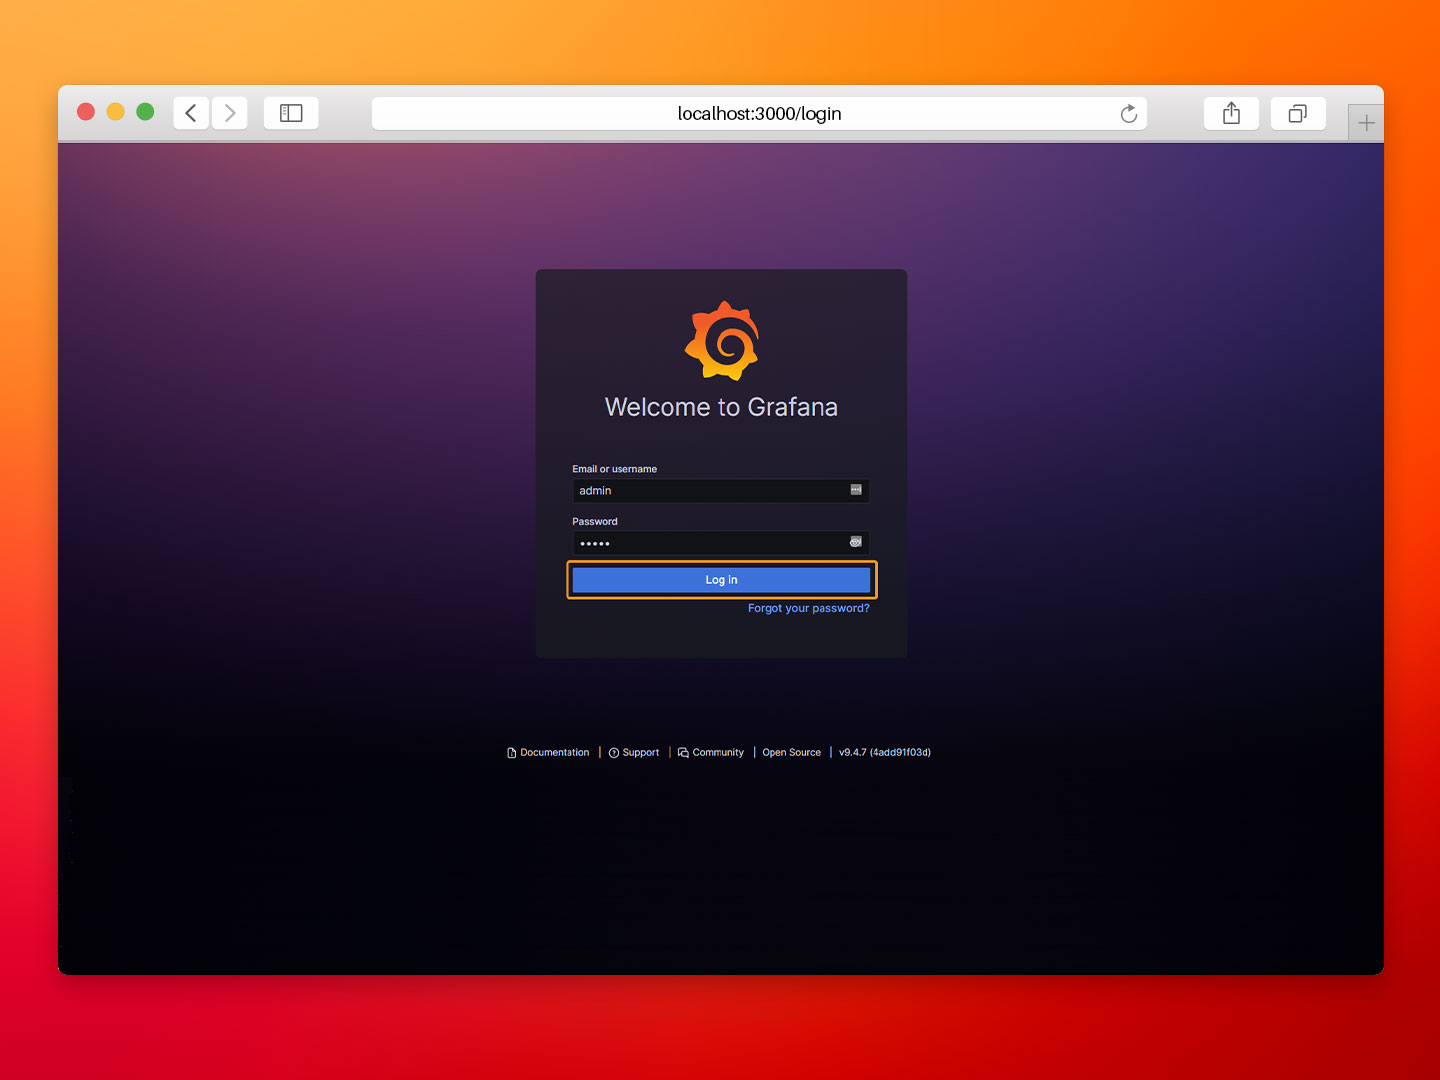
- Step 1: Open your web browser and go to http://localhost:3000/login. Log in with the default Grafana credentials:
- User: admin.
- Password: admin.
- Step 2: Hover the mouse over the configuration gear and select Data Sources.
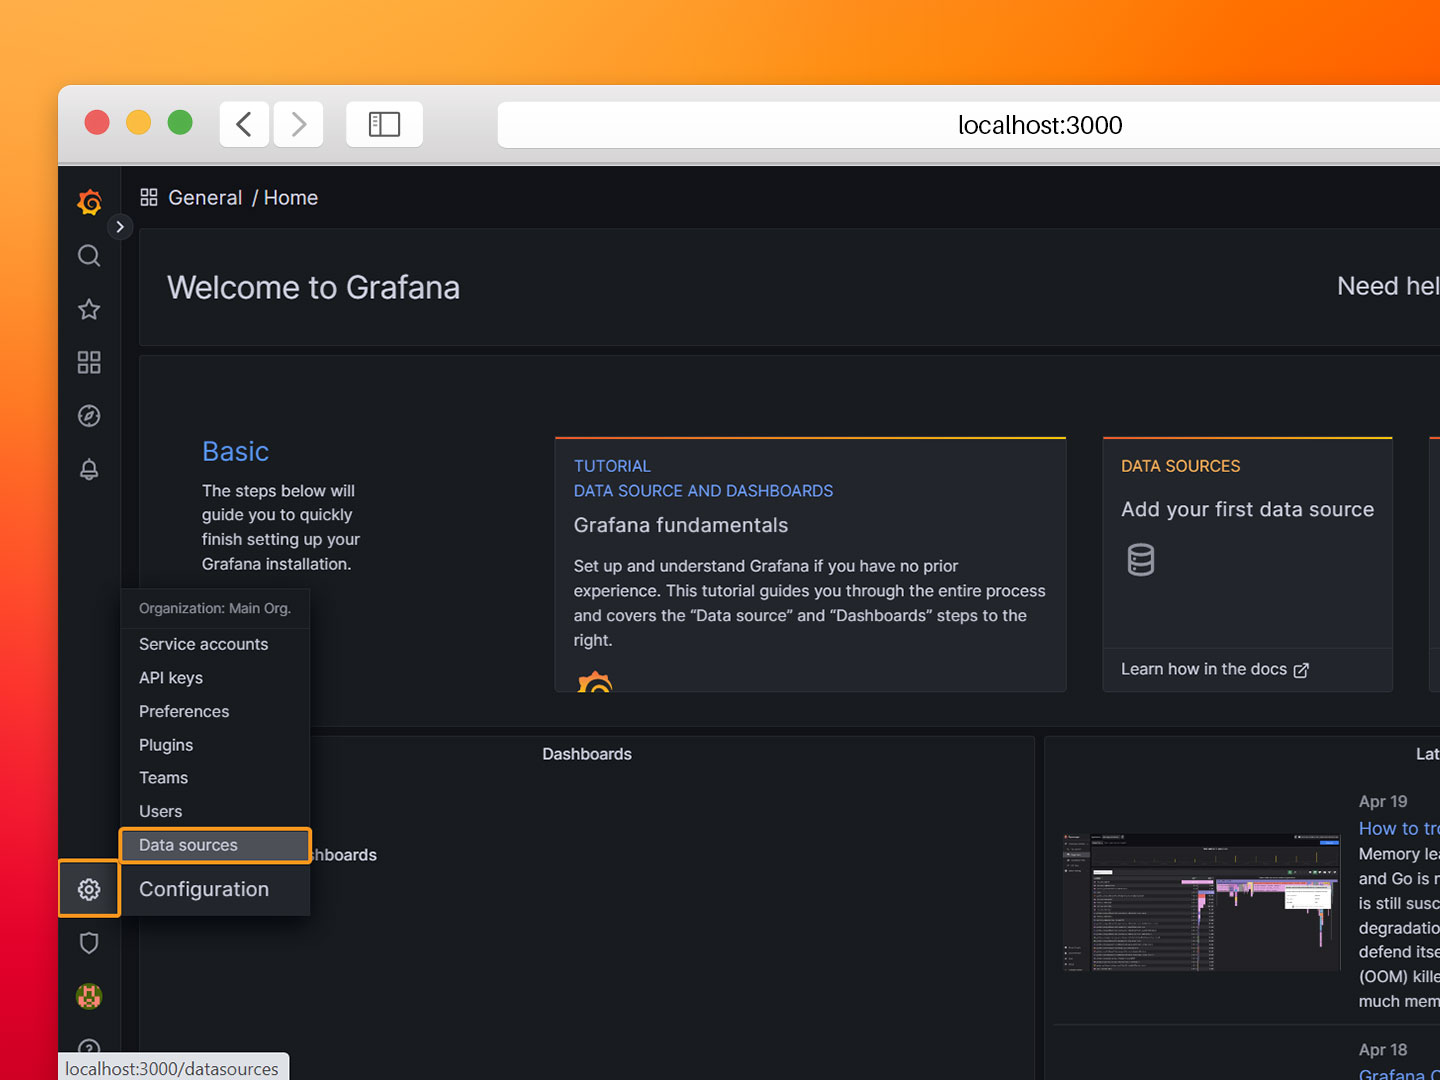
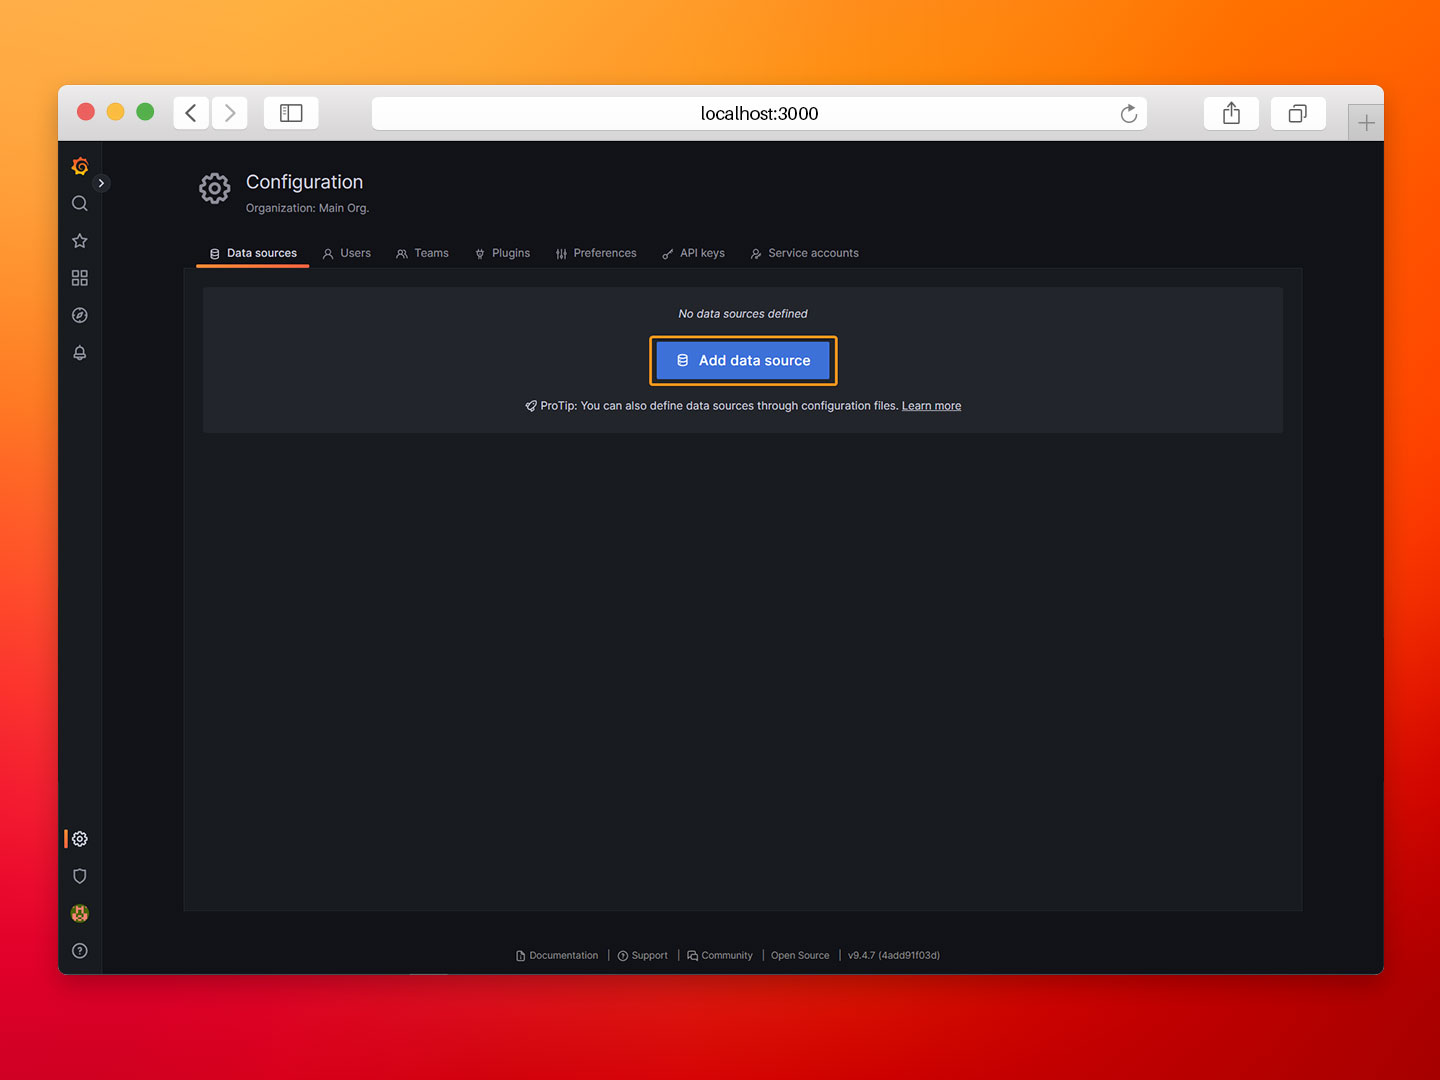
- Step 3: Click on Add data source and select InfluxDB.
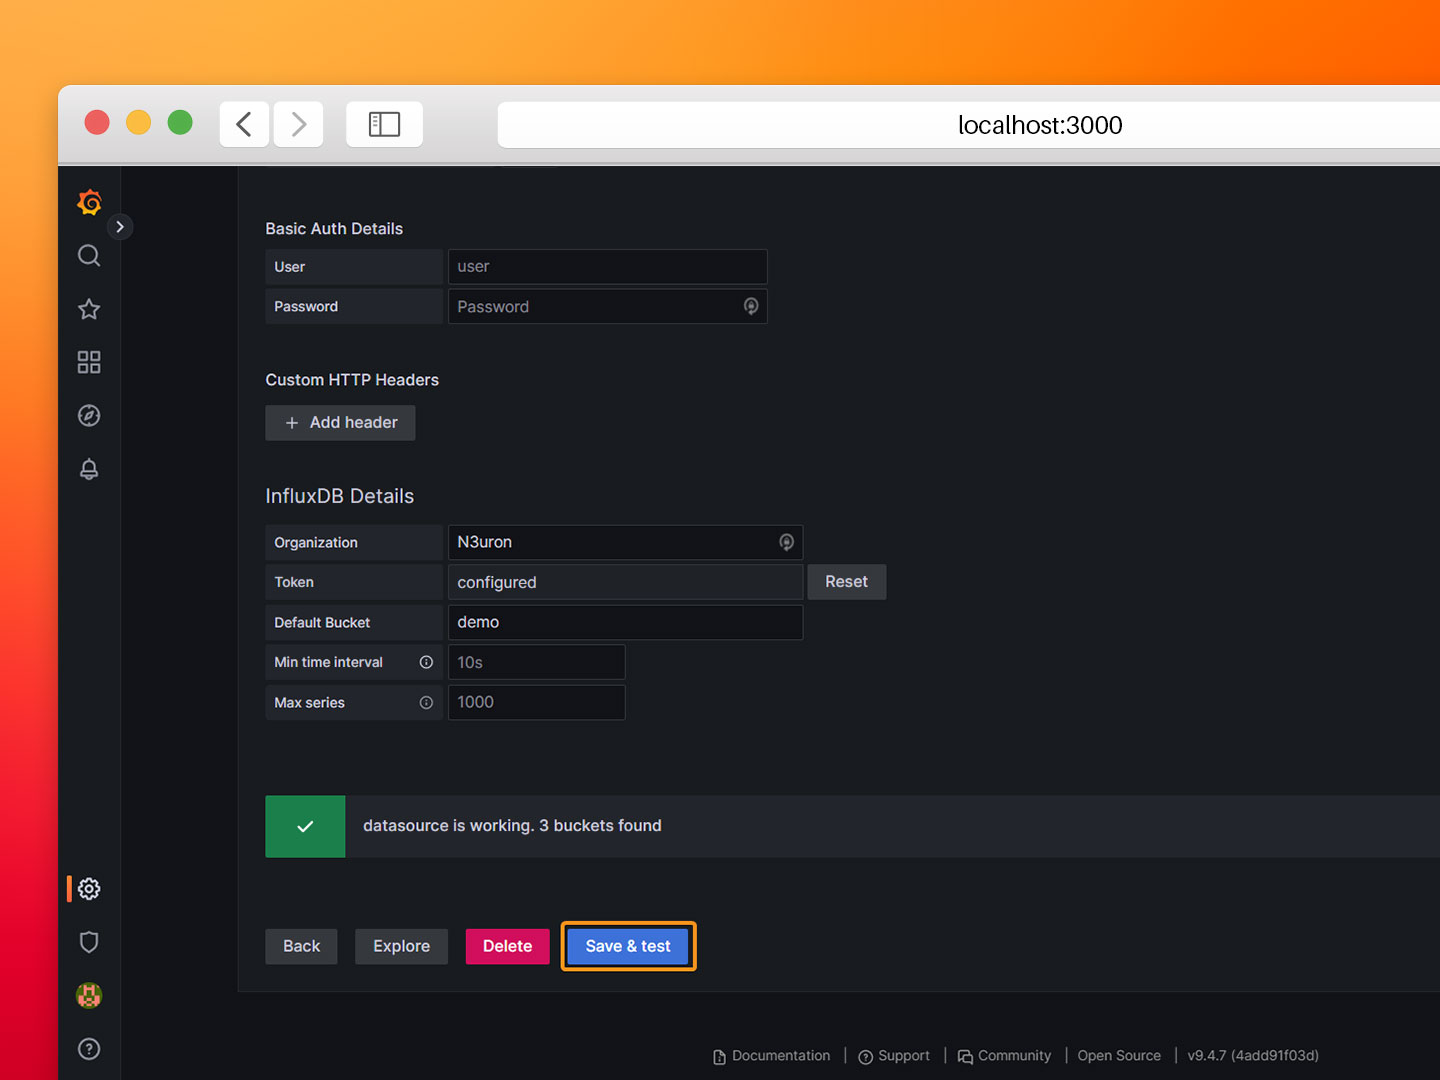
- Step 4: Configure the InfluxDB data source as follows:
- Query Language: Flux.
- URL: http://influx:8086.
- Organization: N3uron.
- Token: <TOKEN>, the one generated in the previous section.
- Default Bucket: demo.
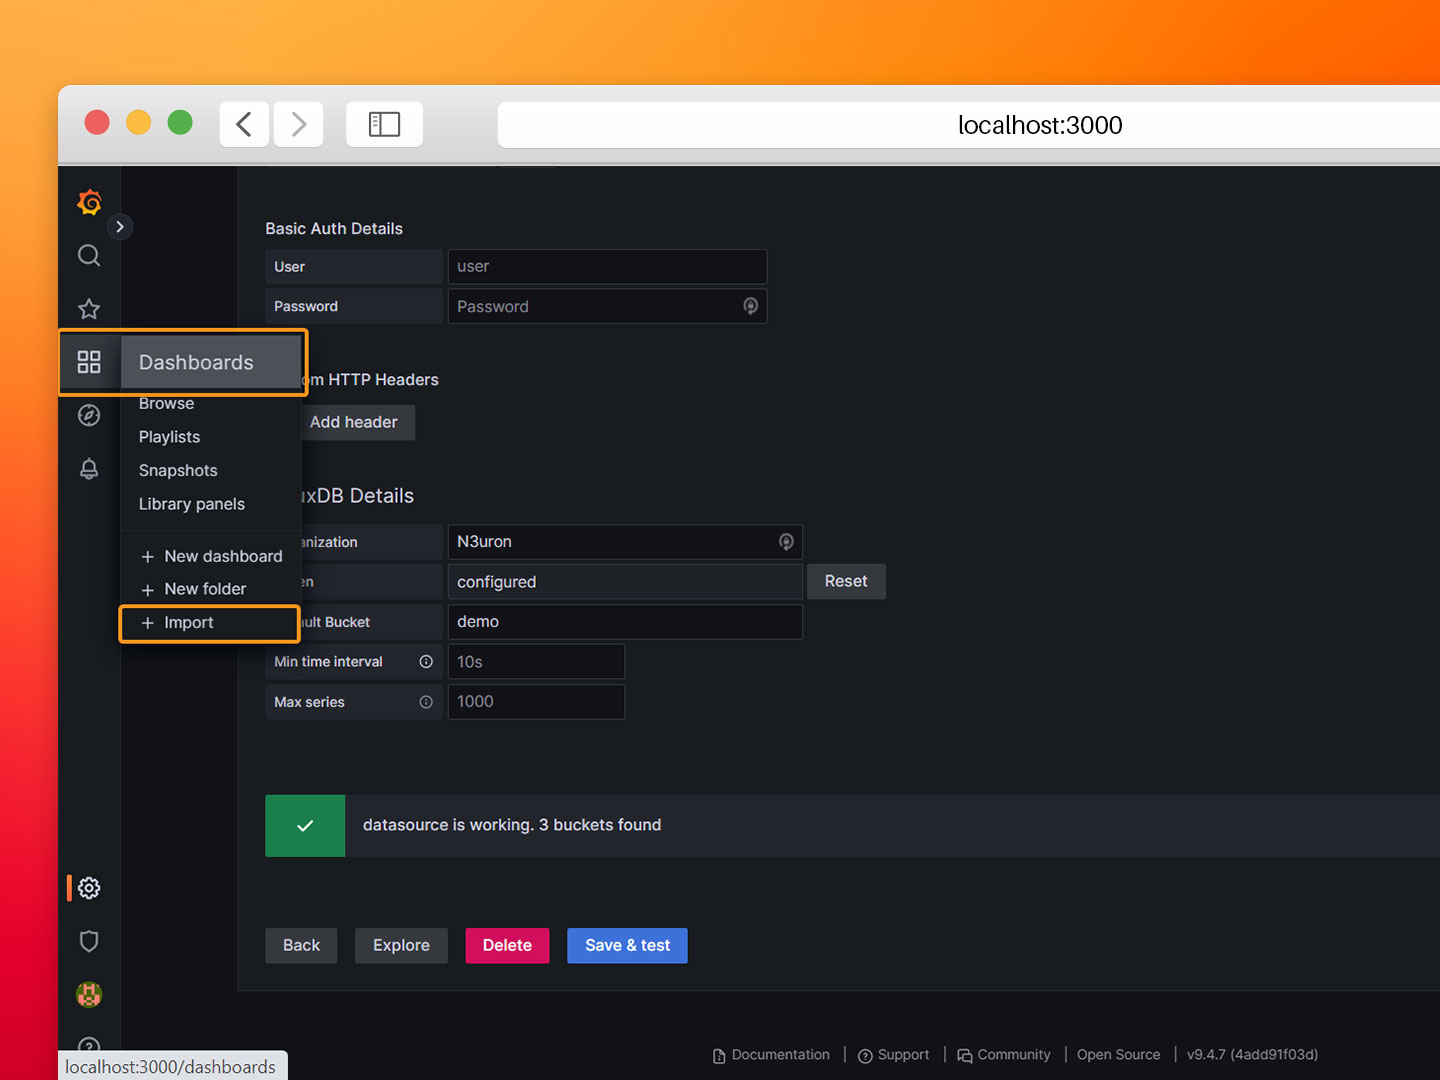
- Step 5: Click on Save & Test and confirm the data source is working.
- Step 6: Navigate back to the main page and click on Dashboards→Import.
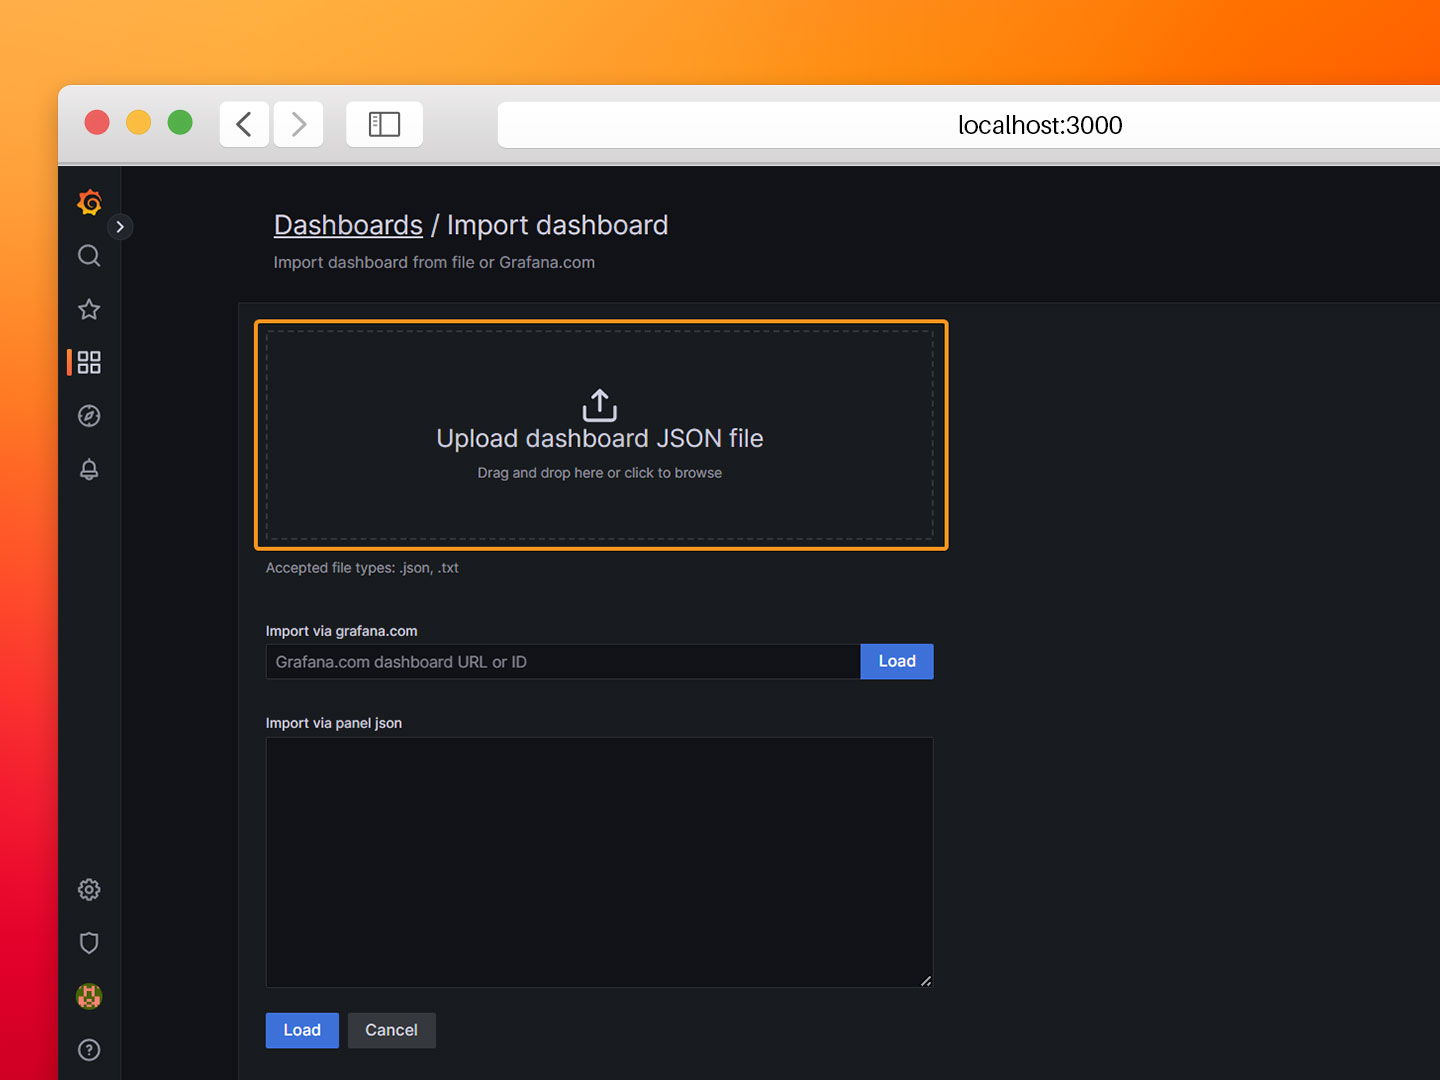
- Step 7: Load the JSON file named ‘PV Site Demo.json’ from the repository. This file contains the dashboard configuration, queries and graphs.
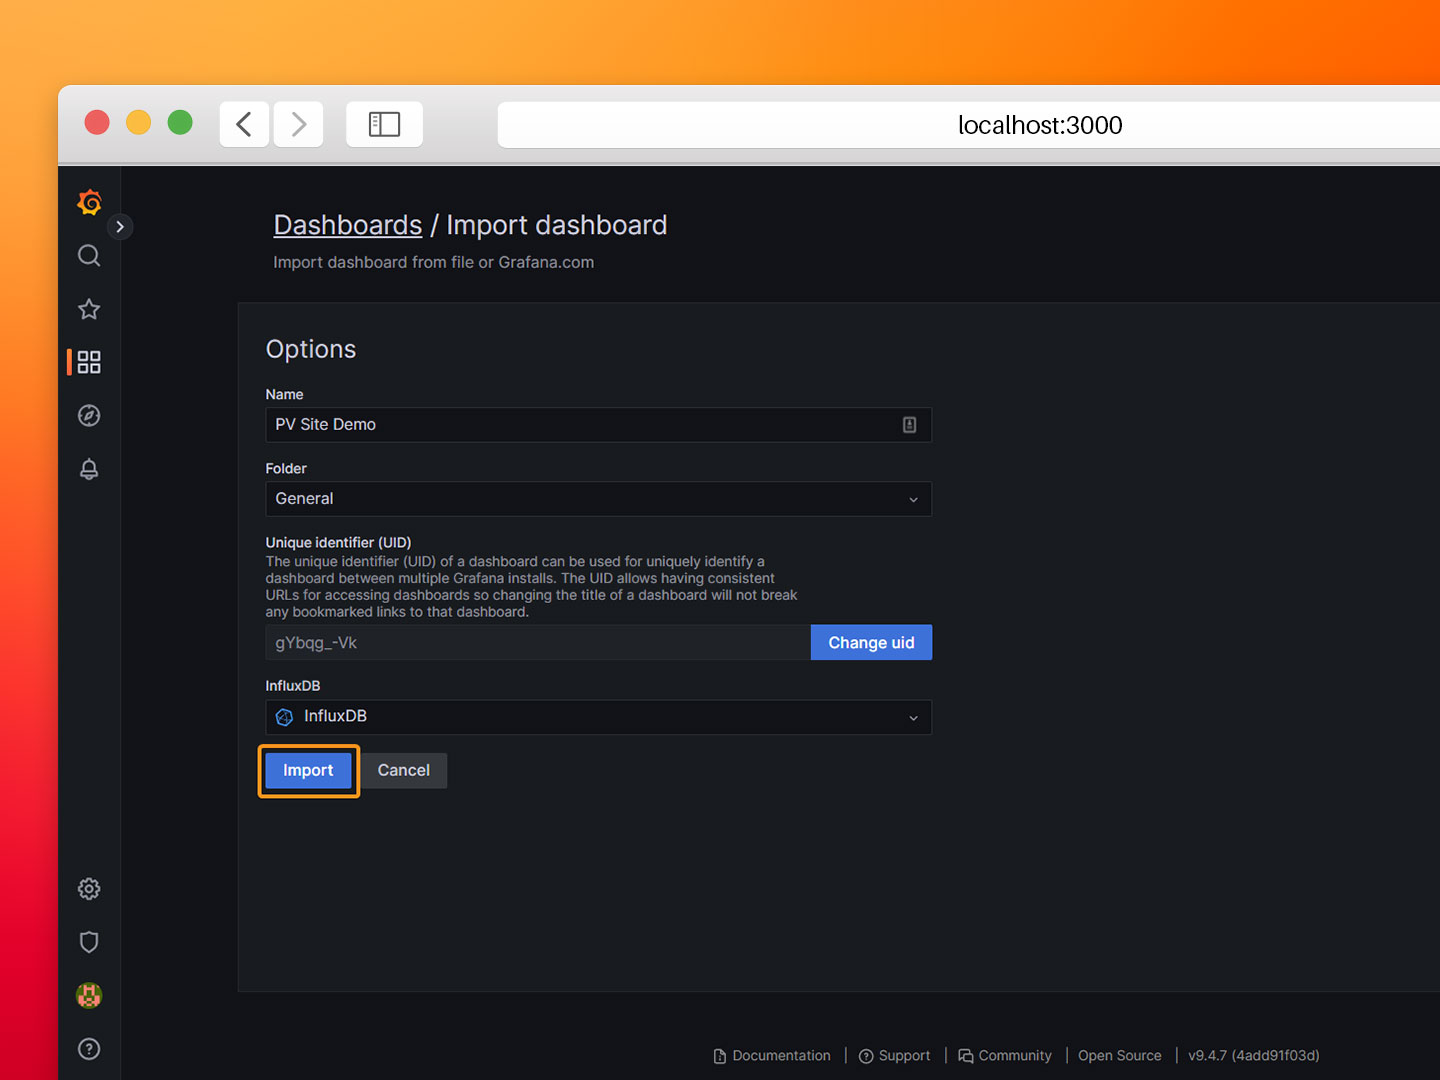
- Step 8: Select the InfluxDB data source and click Import.
That's it! Now you should be able to see your PV site data in Grafana.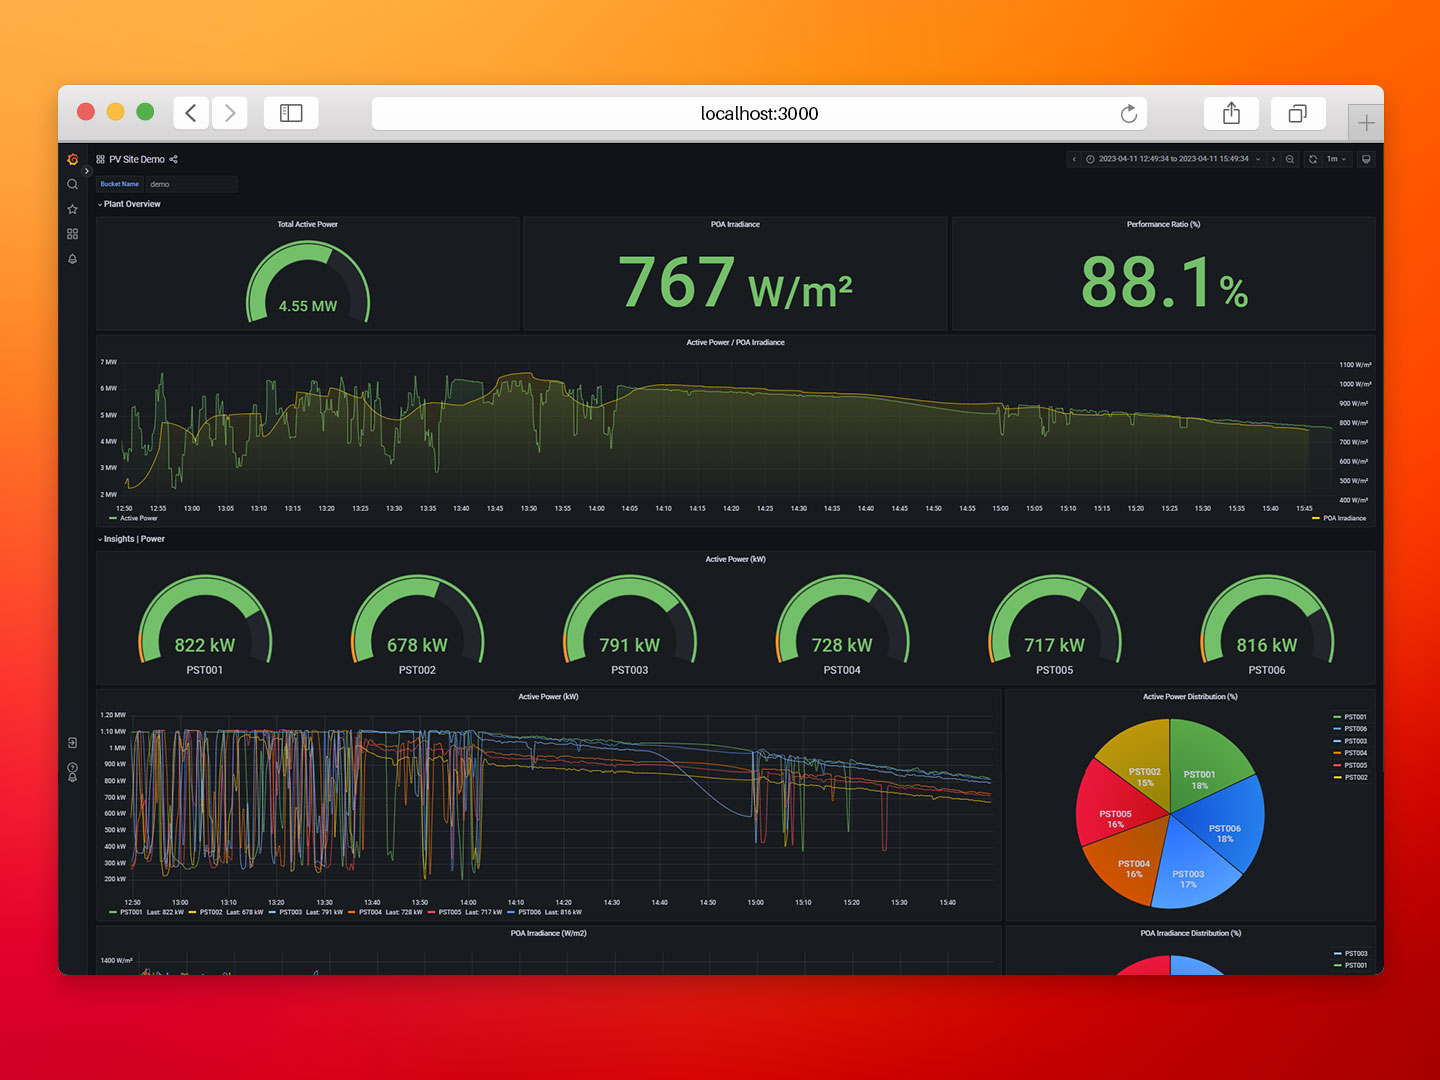
Conclusion
In summary, we have seen how combining N3uron with other applications in a containerized architecture offers a turnkey solution for businesses seeking to unlock the full potential of their data. By deploying this solution at the Industrial Edge, businesses can improve their operations, gain new insights, and stay ahead of the competition. So why not try it out for yourself and see what possibilities await?
Go ahead and download the containerized version of the N3uron platform from Downloads, select the modules you need to start building your own solution, and accelerate your digital journey. The possibilities with N3uron are limitless.