---
title: "Web Vision | Examples | N3uron KB V1.21"
slug: "web-vision-examples"
description: "Web Vision is a N3uron module developed to create pure web HMI and SCADA applications. Based entirely on HTML5, JavaScript and CSS technologies"
updated: 2025-01-20T17:35:16Z
published: 2025-01-20T17:35:16Z
canonical: "docs.n3uron.com/web-vision-examples"
---
> ## Documentation Index
> Fetch the complete documentation index at: https://docs.n3uron.com/llms.txt
> Use this file to discover all available pages before exploring further.
# Examples
## [](/v121/docs/web-vision-examples#_Toc63160050)Linking tags to a property
To display tag values using components, such as the gauge component, the value of the component must be linked to the tag that will be displayed. It is important to note that any tag property can be linked, not just the value. For example, to link the tag value of a specific tag, the EU of the same tag, and the quality of the tag to the value, EU, and quality of a gauge's container respectively, you can use the following code.
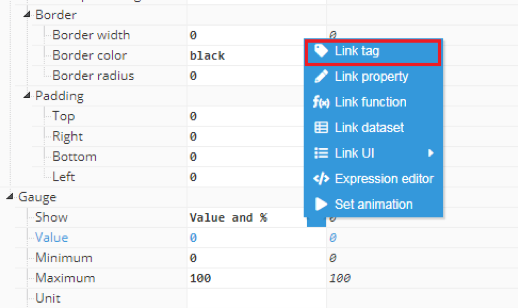
Firstly, a gauge component should be created in the container. Once created, the **value** field should be selected and the input options button clicked to select the “**link tag**” option, as shown in the below screenshot:
After clicking the **link tag** button, a popup will appear with a list of tags to link to:
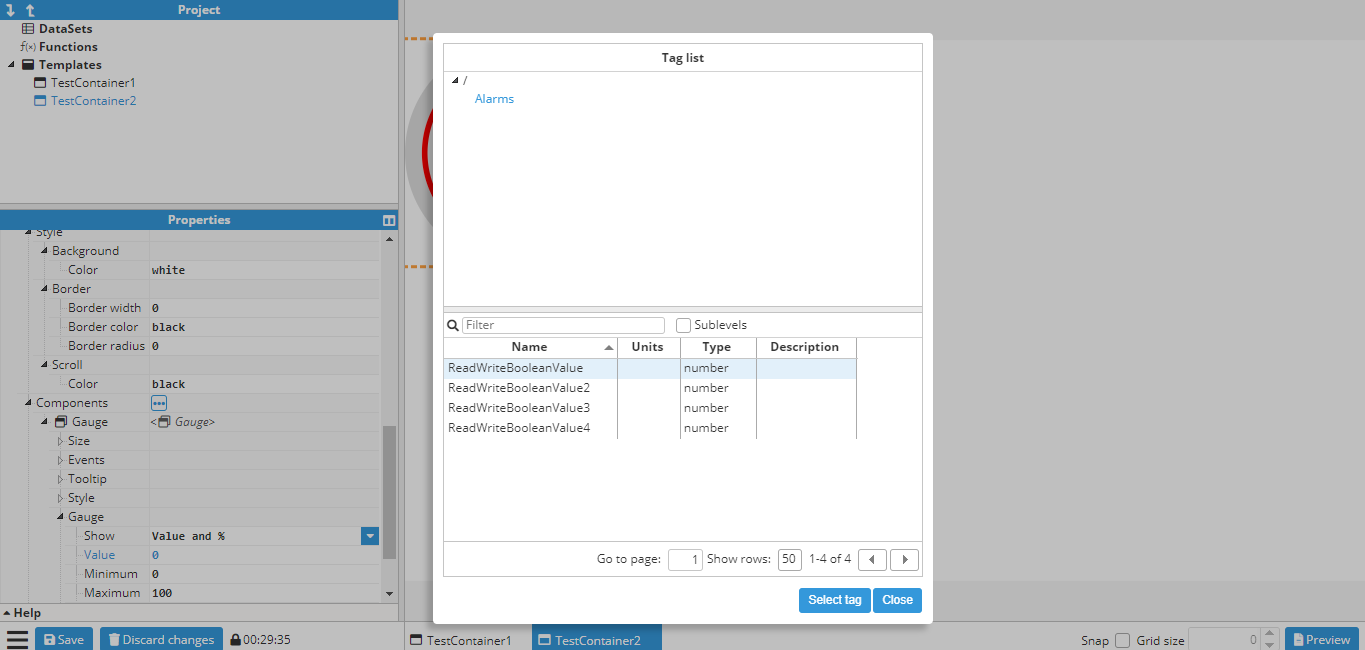
In this example, the tag is “/ReadOnlyNumber”. After selecting the tag, another popup allows users to select the property:
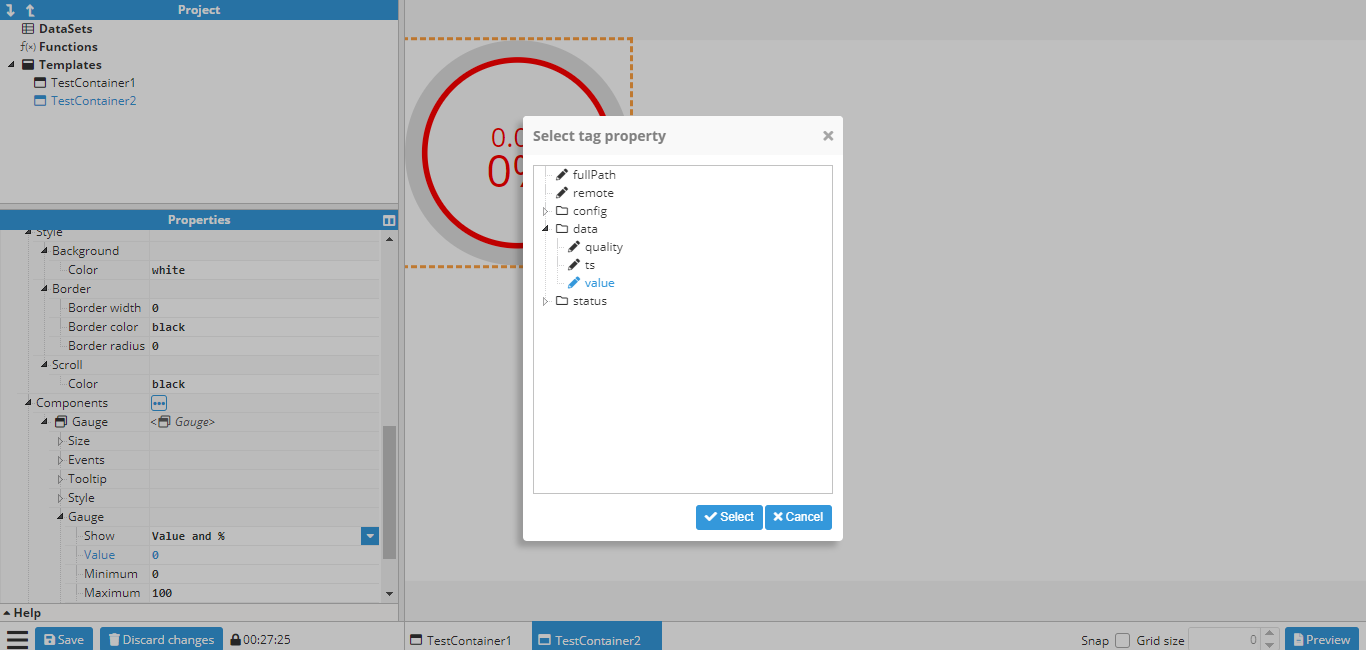
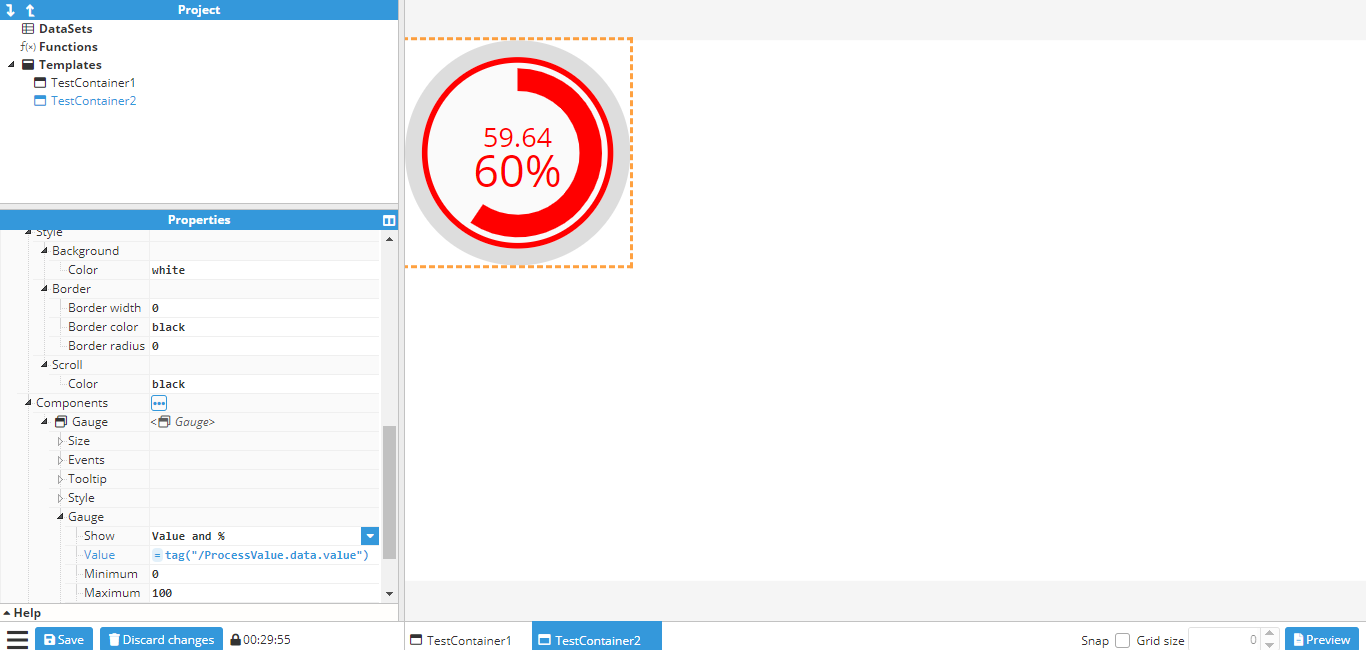
After selecting the tag value, the value field changes to =tag(“/ReadOnlyNumber”), which is how a tag is linked internally (More information in Tag function).
Follow the same procedure to link the **engineer units** to the tag’s engineer units and the same for the **quality** section (located in the container section) in order to link the tag. The resulting gauge will look like this:
## Writing values to tags based on an event
The following screenshot shows the available events for an input component:
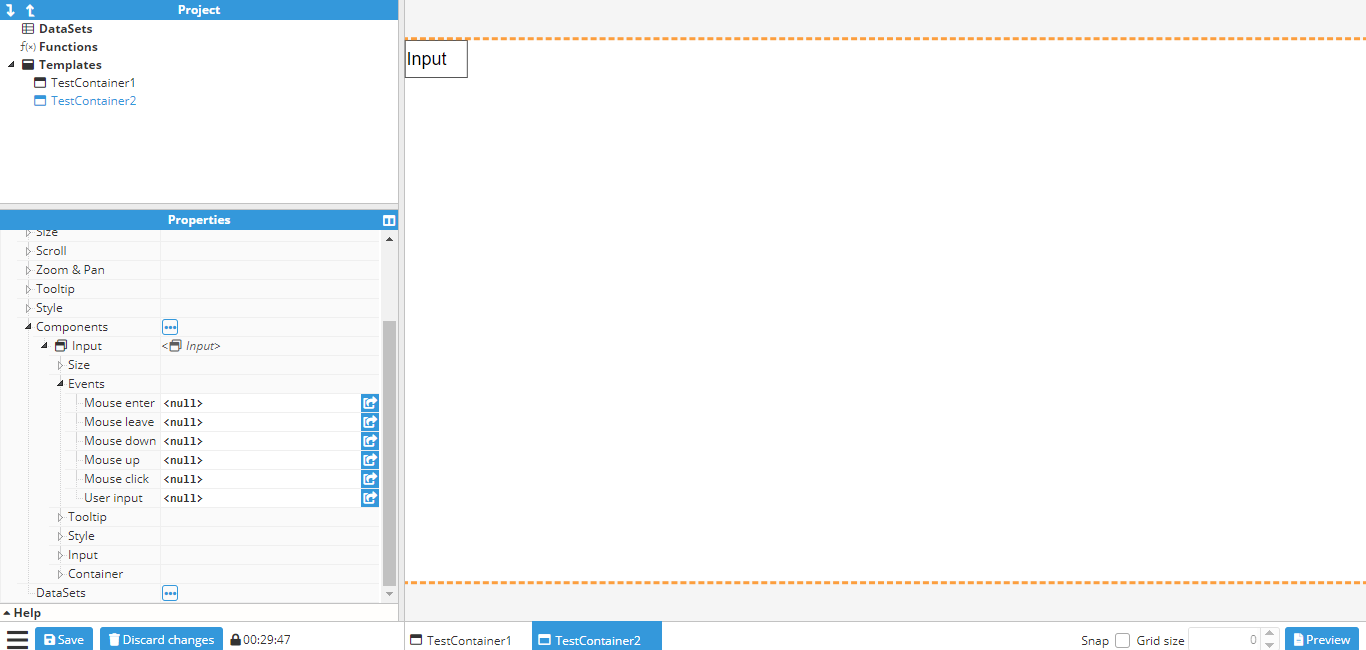
By clicking on the button indicated with an arrow, a popup is displayed to allow users to create actions for that event. In this case, for binding the **User input** event to a write tag action. By clicking on the “add action” button, a new popup will appear to allow the user to select which action to execute. In this case, write tag has been selected to bind the value to be written to the To display tag values using the gauge component, the value of the component must be linked to the tag that will be displayed. It is important to note that any tag property can be linked, not just the value. For example, to link the tag value of a specific tag, the EU of the same tag, and the quality of the tag to the value, EU, and quality of a gauge's container respectively, you can use the following code.To display tag values using the gauge component, the value of the component must be linked to the tag that will be displayed. It is important to note that any tag property can be linked, not just the value. For example, to link the tag value of a specific tag, the EU of the same tag, and the quality of the tag to the value, EU, and quality of a gauge's container respectively, you can use the following code.input text:
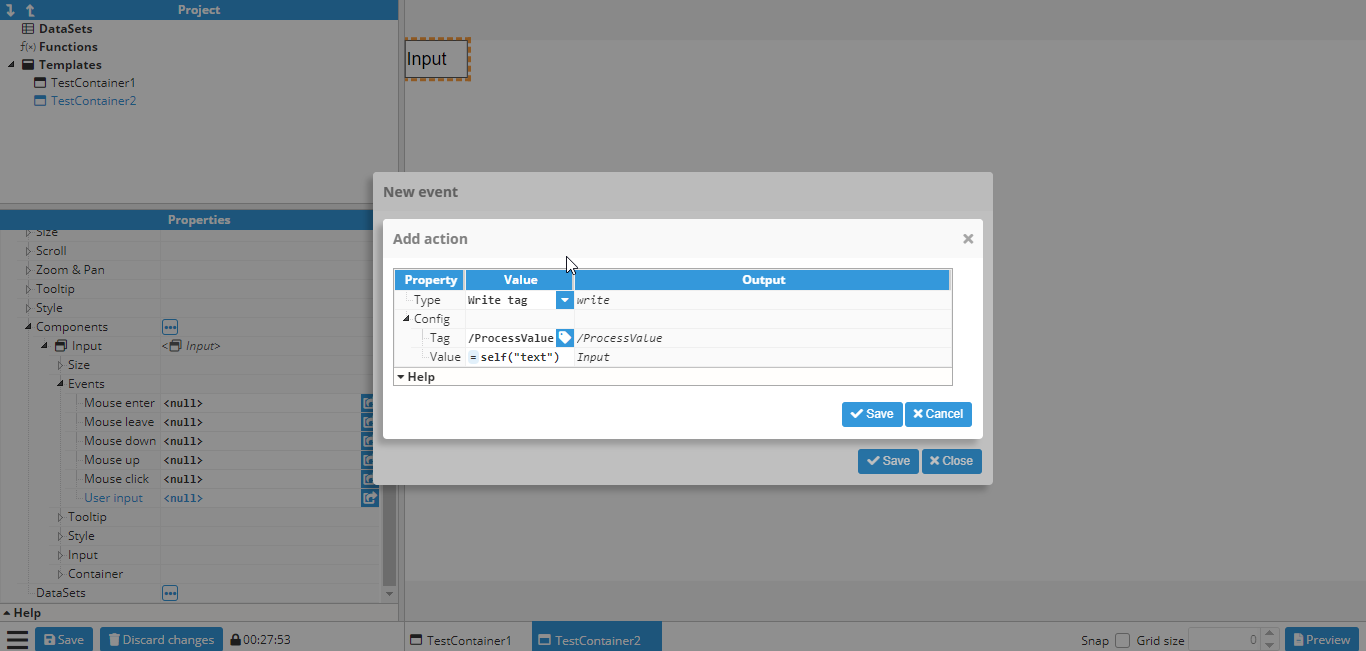
A write tag action is shown with “/ReadWriteNumber” as the tag and =self(“text”) as the value. More information about the “self” function can be found here.
## Adding markers to a map
The following example adds fixed markers to a map, which will always remain in the same coordinates regardless of the map’s pan or zoom settings.
Firstly, a **map container** should be created and if needed, the **initial longitude, latitude and zoom levels** should be set up.
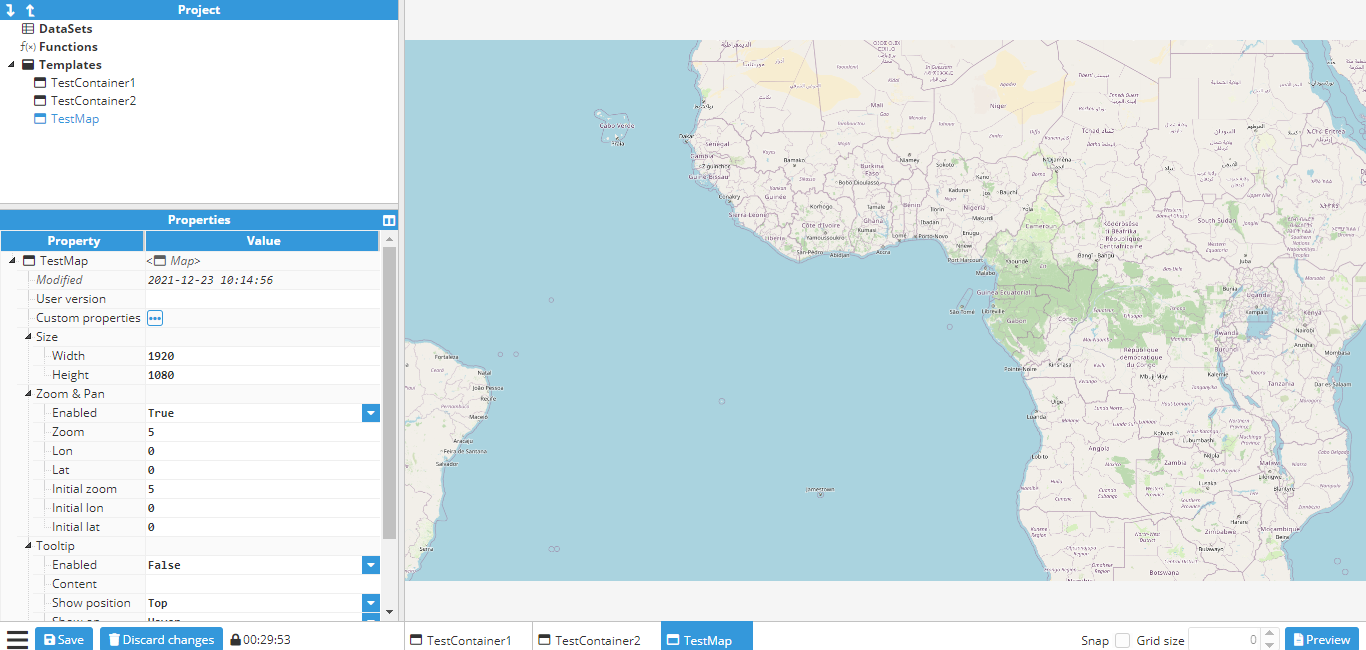
Next, the markers are created. This requires the use of an Icon component, since an **icon** called a **marker** is available to use, which is perfect for this purpose. When creating new components, the origin is set to (0,0) by default, which means that it will be positioned using the top left corner as the reference point. Since the bottom of the marker needs to be fixed in position, the origin must be changed to the bottom center, which is (0.5, 1). The **marker** is now placed in its final location, which in this case is Madrid.
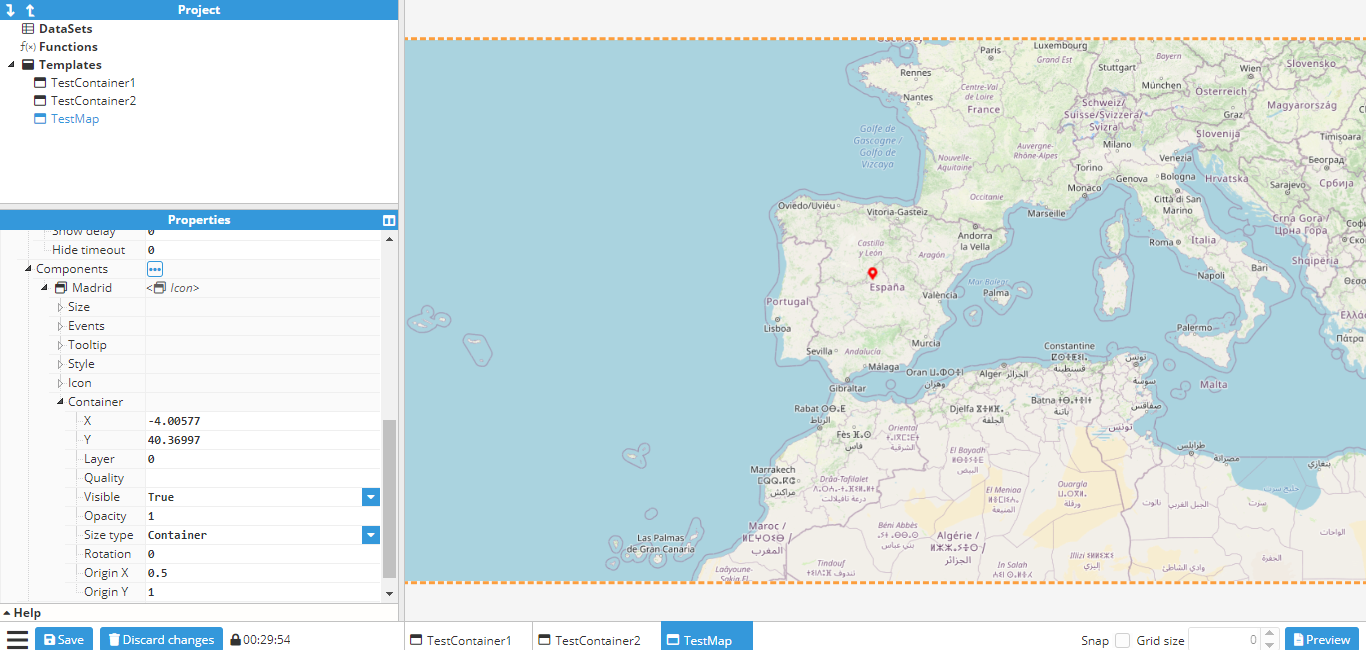
The icon can be duplicated by either right clicking and selecting duplicate, or alternatively, clicking on the icon, using CTRL+D and then placing it in the new coordinates. To finish this example, two more markers are created; one in Berlin and one in London. The final map will be as follows:
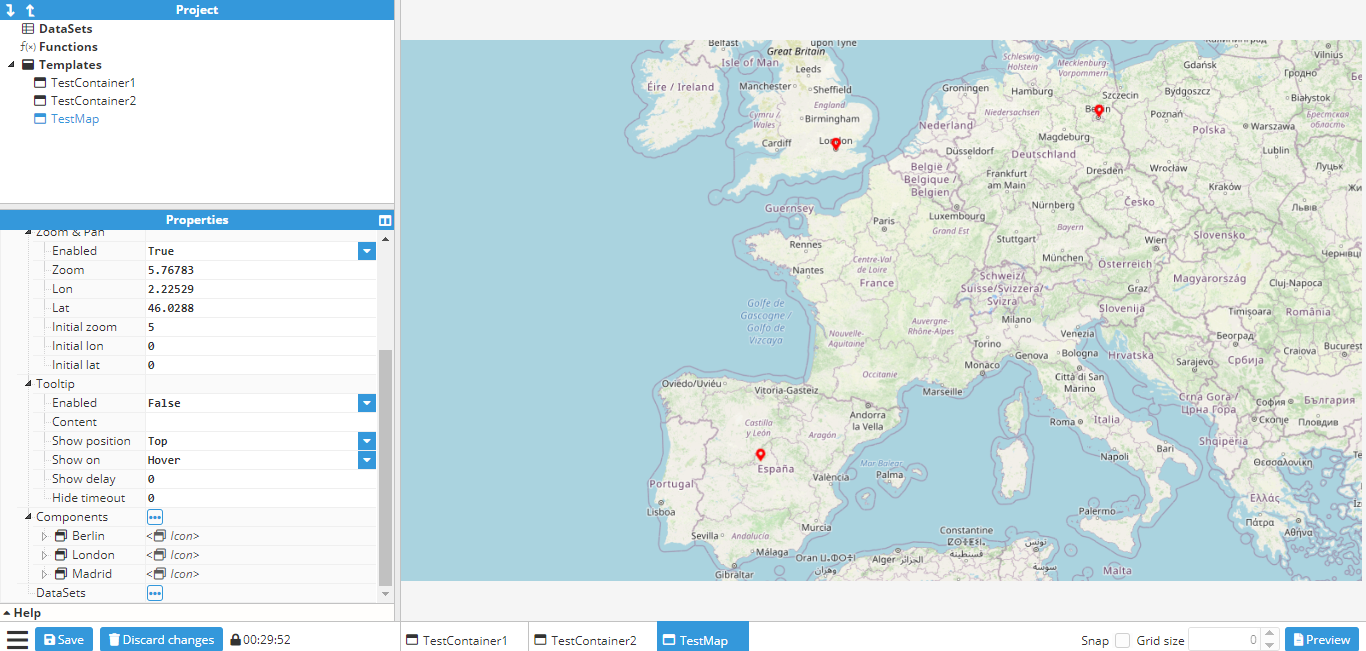
By default, these markers won’t do anything. However, just like any other component, events can be attached to them and as such, markers can be used to display a popup (as seen in the Creating a parameterized popup).
## Click to display a popup
This example shows how to create a popup with a gauge that can be opened and closed by pressing a button. In order to do this, the first step is to create a popup template by creating a new empty **container** of 500x500 pixels and then adding a **gauge** and **label** inside the container. The gauge will point to a tag called /ReadOnlyNumber, which in this example is a memory tag. The label will display the tag name.
The properties of the container, gauge, and label can be seen in the following screenshots:
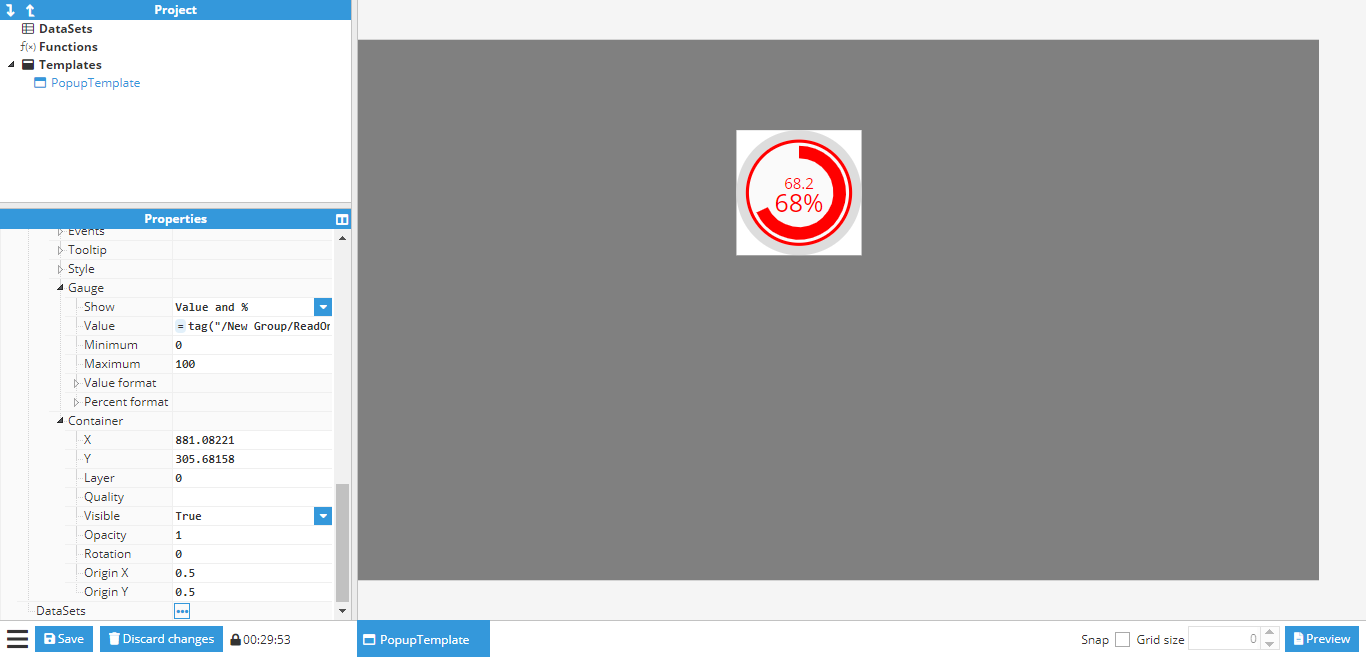
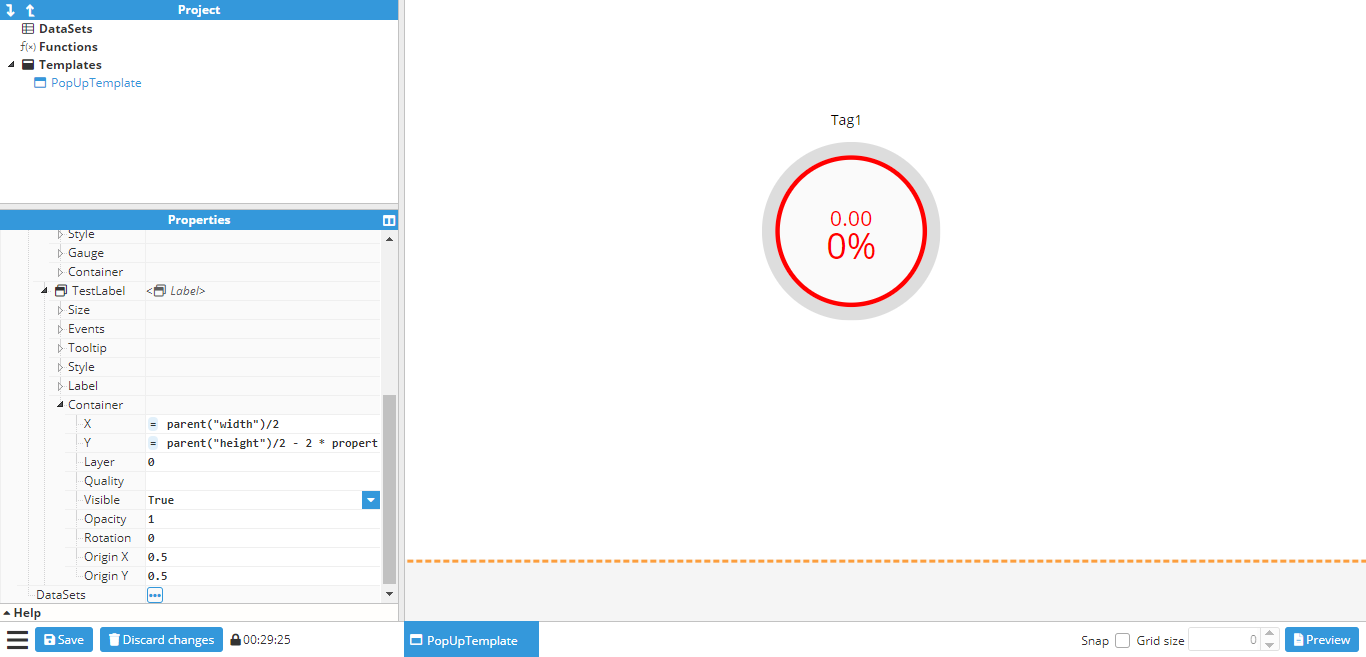
As seen in the example, the position of the gauge and the label are relative to the container size, this is achieved by using the property function to obtain the height and width of the container.
Once the desired popup has been created, it’s time to create the main window where the popup will be displayed. This window will be a 500x500 container named **Main** and will contain a button called **ShowButton**. To view the popup that has been created, the background color of the main window can be changed to gray, as shown in the following screenshot:
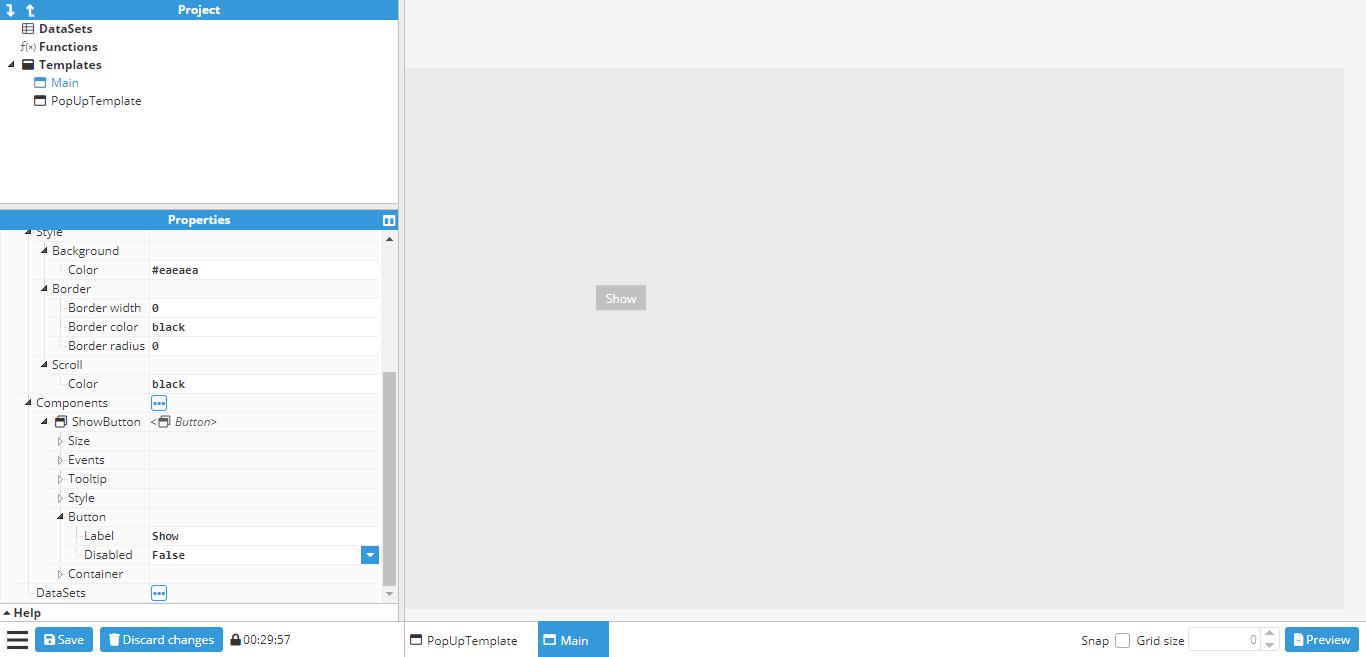
Next, an instance of the popup template needs to be added as a component. Once added, it can be placed in the desired position for display, before changing the **visible** property under the container to false. This will hide the popup, although the outline of its location will still be visible, as shown in the below screenshot:
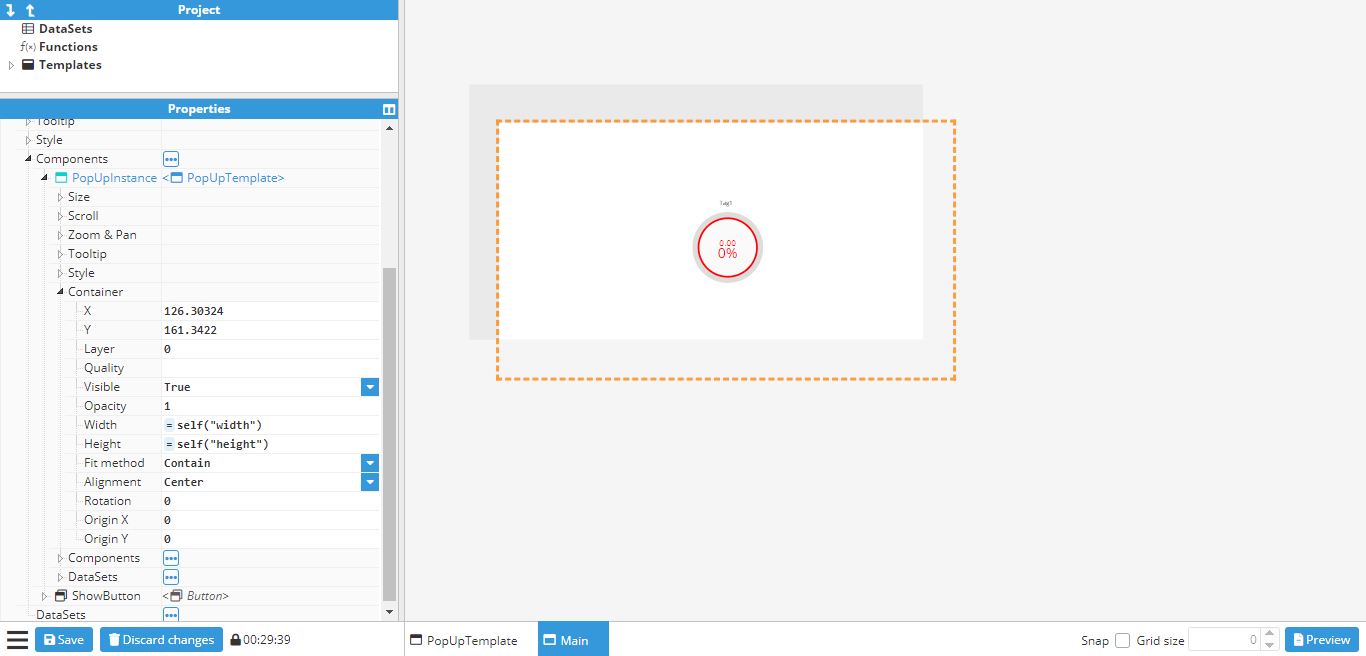
To display the popup, an action needs to be attached to the **click event** on the **button**. This will set the **visible** property of the popup to the inverse value, which means it will be shown when hidden and closed when visible:
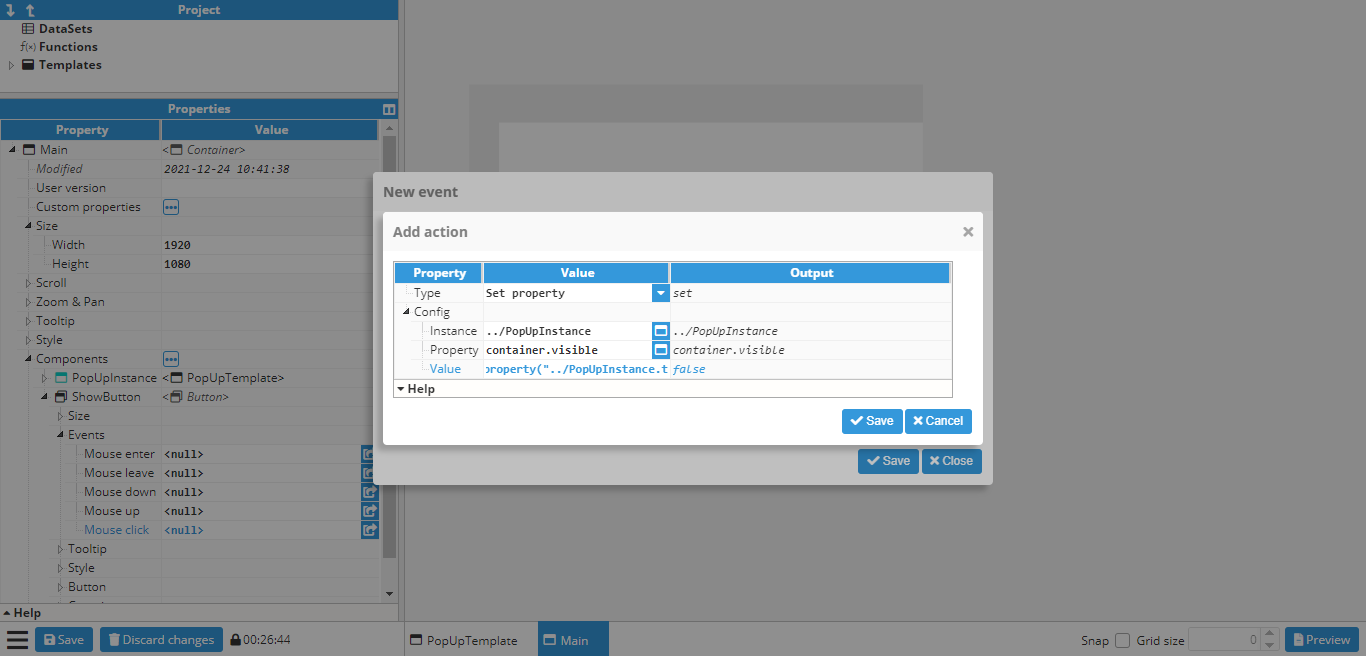
Since the value needs to be the opposite of the current visibility value, the following expression is used:
```javascript
=!property(“../Popup.container.visible”)
```
One more action still needs to be added in order to change the text property of the button to “Show” or “Hide”, depending on whether the popup is visible or not:
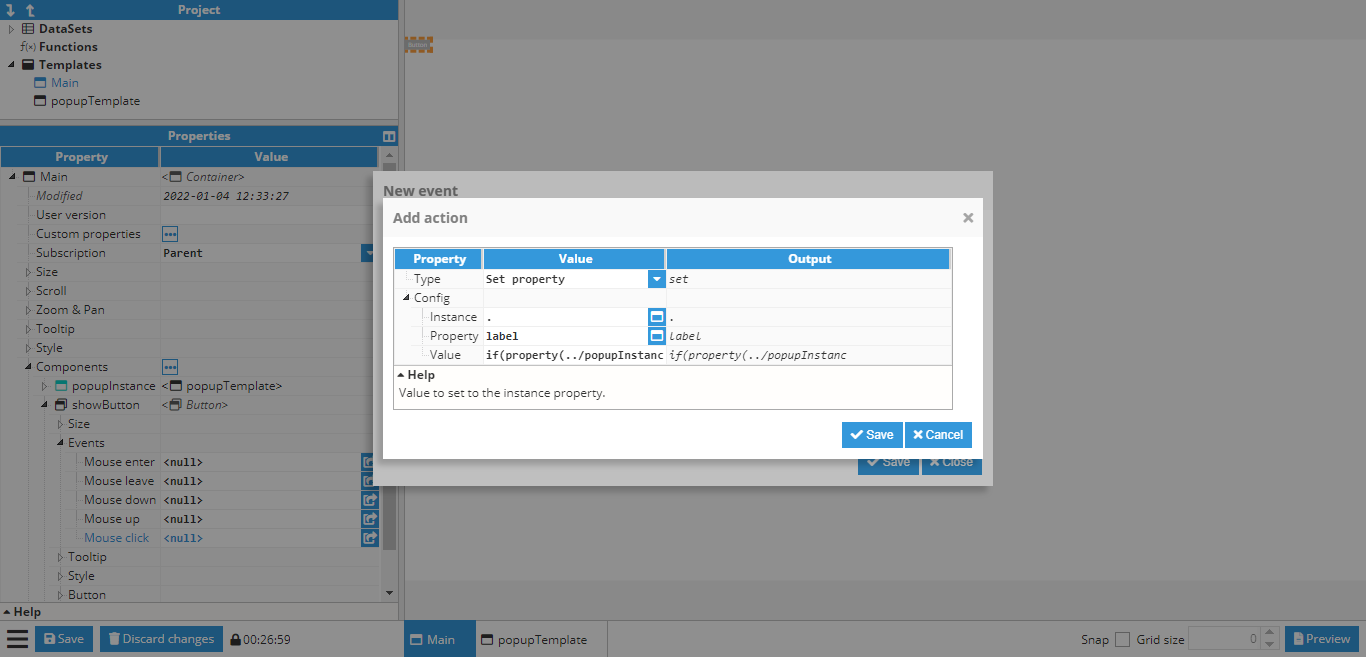
In this case, the value to be set to the following expression is as follows:
```javascript
=if(property(“../Popup.container.visible”))“Hide”; else “Show”;
```
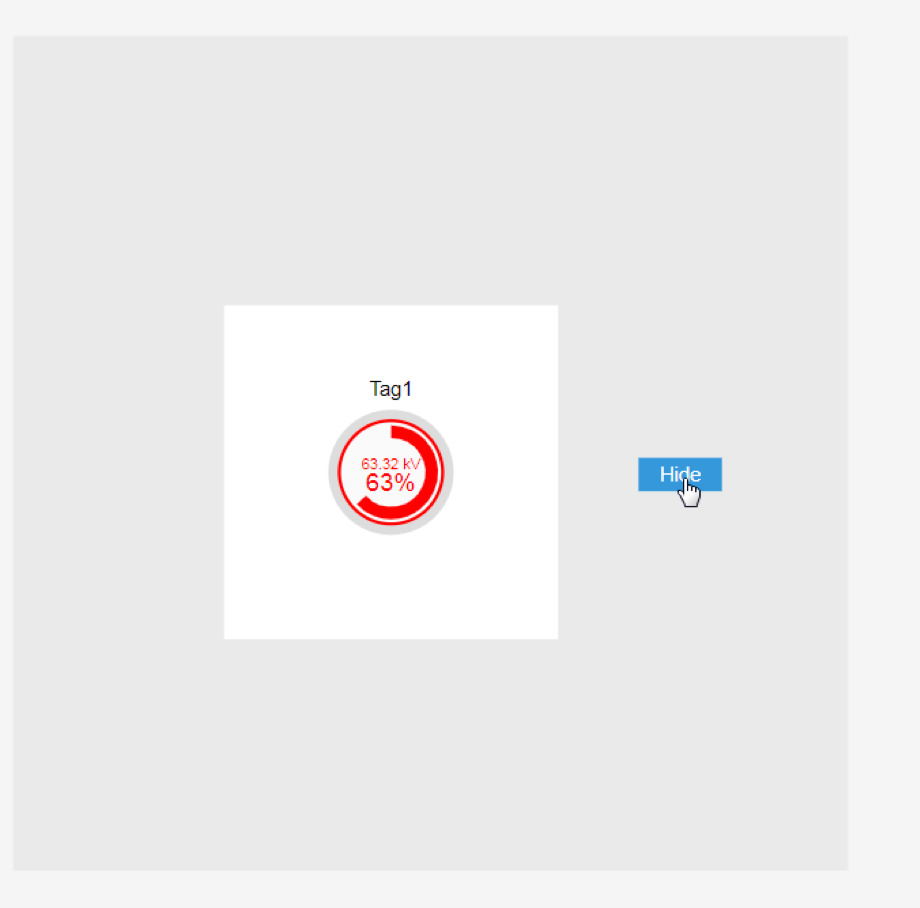
Finally, the popup is ready to be tested, either by pressing CTRL+Click on the button while the button is not selected or by going to the preview mode and clicking the button:
## Creating a parameterized popup
This is a follow-up to the previously shown examples. In the previous example, a popup was created and set to always display the value of the same tag using a gauge. In this example, a parameterized popup will be created to slide open by clicking on a map marker and show a different tag depending on which marker was clicked on.
First of all, the popup window needs to be created. In this case, it is a 400x1080 window with a text custom property called **basepath**.
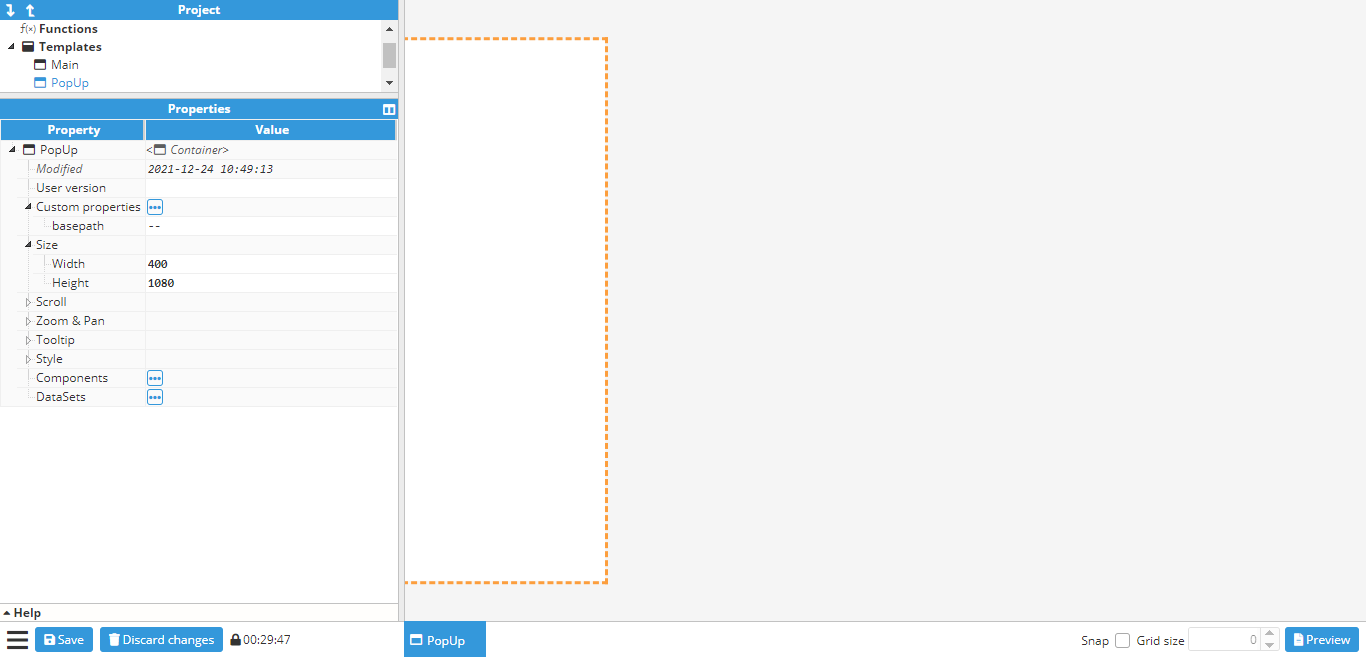
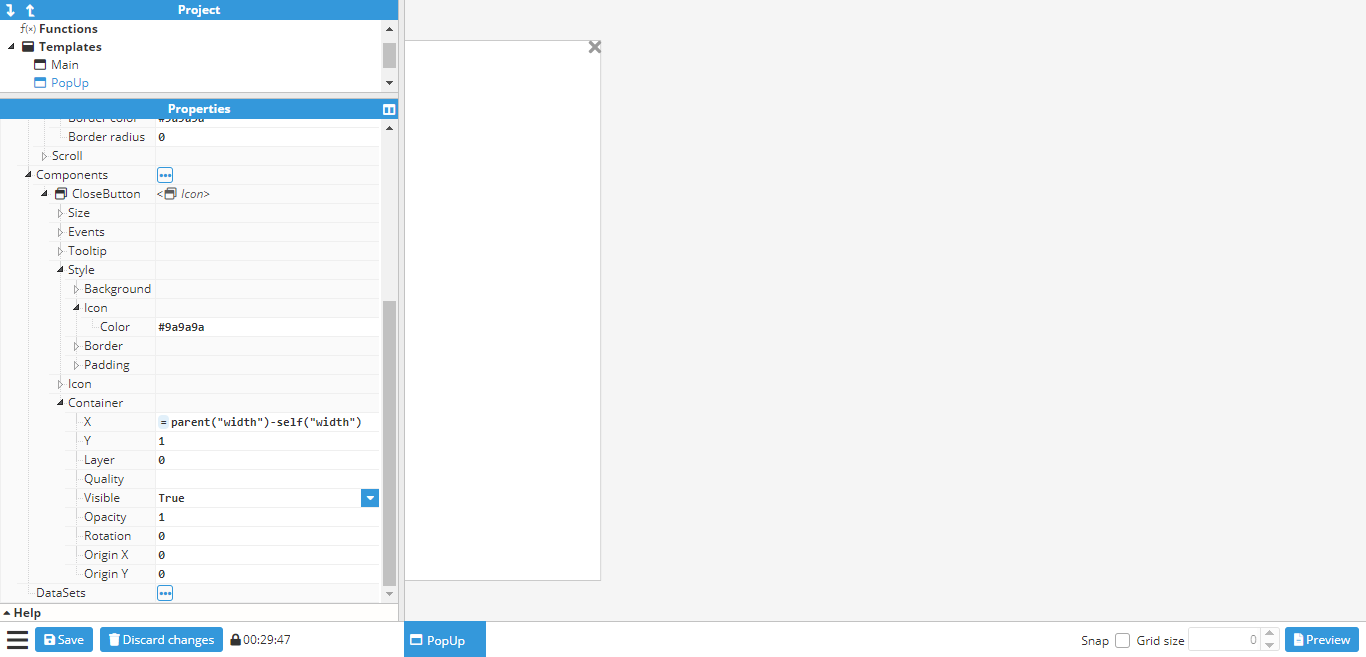
Next, a border is added to the container using general-style properties. After creating the border, the **close** button needs to be created in order to close the popup when clicked on. To do so, an **Icon** component should be used, which in this case will be the **times** **icon**. It is positioned in the upper right corner of the popup:
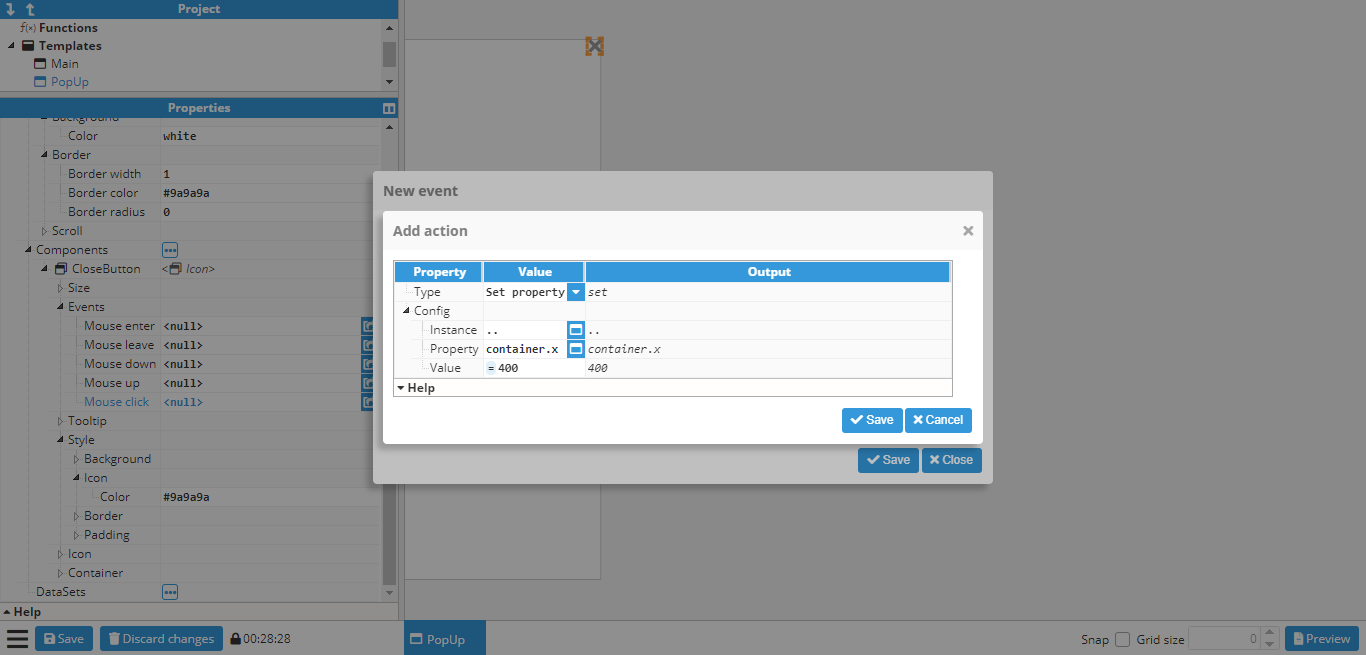
A **click event** needs to be attached to the close button in order to close the popup. However, the helper popup cannot be used to select the x property for sliding it out of view as there is no container section in the popup. This happens when the container is a template and not an instance. However, container properties can still be applied by inputting them manually. In this case, the x property should be set to -400 (since 400 is the width of the popup, meaning that -400 will set it out of view. Alternatively, the width of the container can be linked). To do so, the following settings are applied:
The last step is to add in the **gauge** and link it to a tag. However, in this case, the tag path is not static, as it depends on the **basepath** dynamic property. This example assumes the following tags are used:
```javascript
/Madrid/Temperature
/London/Temperature
/Berlin/Temperature
```
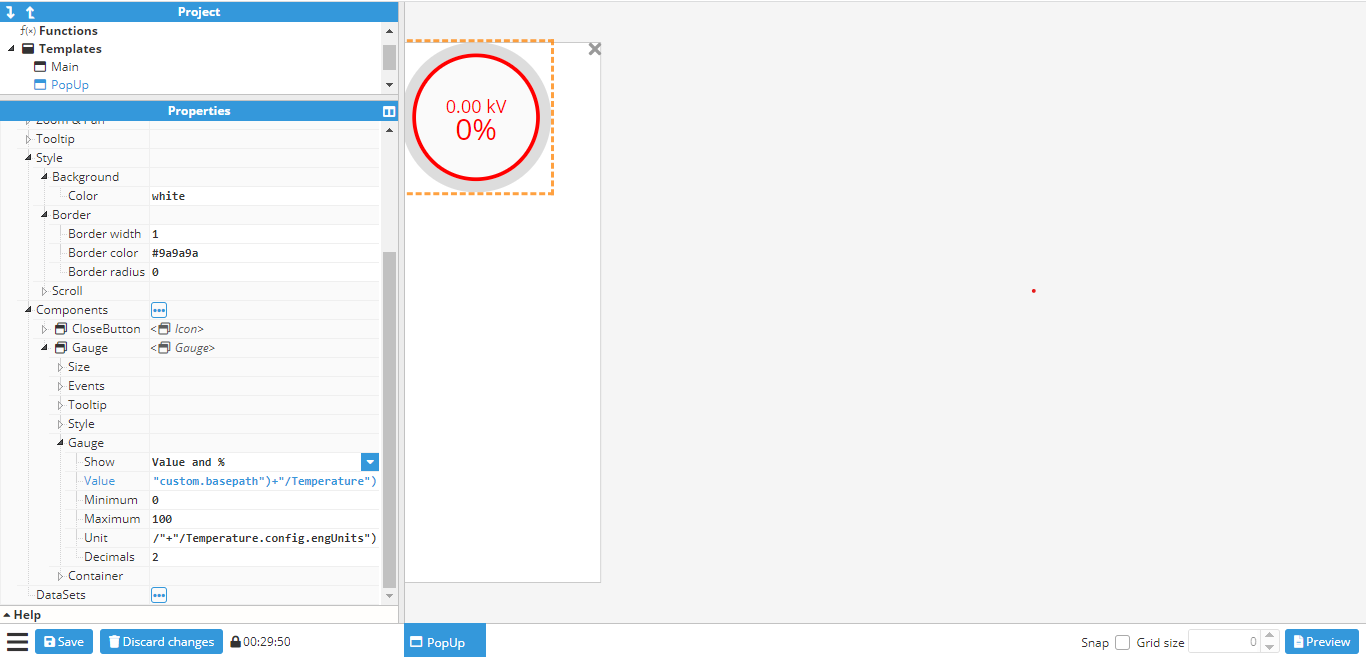
Since the tags all follow the same structure (//Temperature), the **basepath** property can be used as the first part of the tag name, which corresponds to the city. To do so, the following expression is used in the gauge value (and in the units too, if the same EU and tag need to be used):
```javascript
=tag("/"+parent("custom.basepath")+"/Temperature") -> Value of tag
=tag("/"+parent("custom.basepath")+"/Temperature.config.engUnits")-> Units of tag
```
The final popup will look as follows:
Now that the popup has been finished, the main container can be created. In this case, instead of the steps used to add markers to a map, the main container needs to be a blank container, rather than a map. The reason is that if it were a map, the popup would be instantiated as a component of the map, and would be positioned at a latitude and longitude, which is not the desired outcome in this example. In this case, the popup needs to be set in an absolute position on the screen. This can be accomplished by creating a **blank container** and adding a map and the popup as components, as shown in the below screenshot:
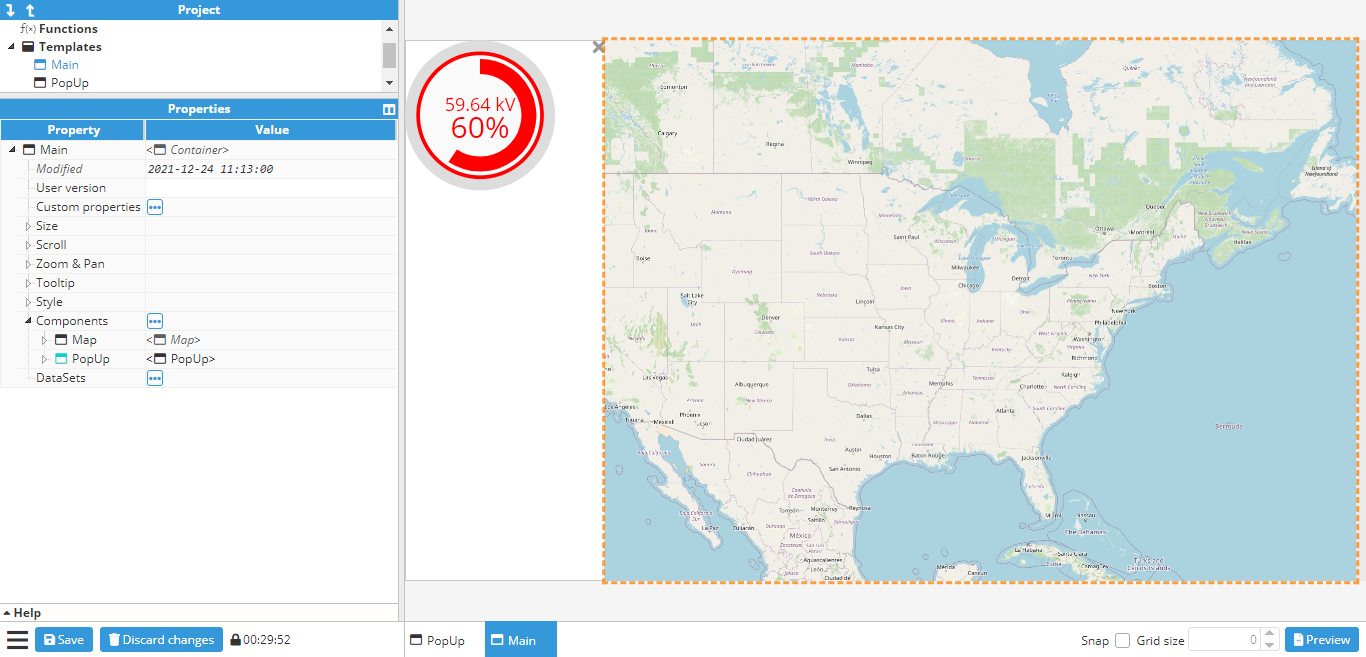
In this example, the popup will be shown by sliding from left to right using an animation. In order to achieve this, the popup’s initial **X** position needs to be set to -400 (since the popup is 400 pixels wide). An animation also needs to be added to the **X** property. In this case, it will be set to last 1000ms and ease in & out.
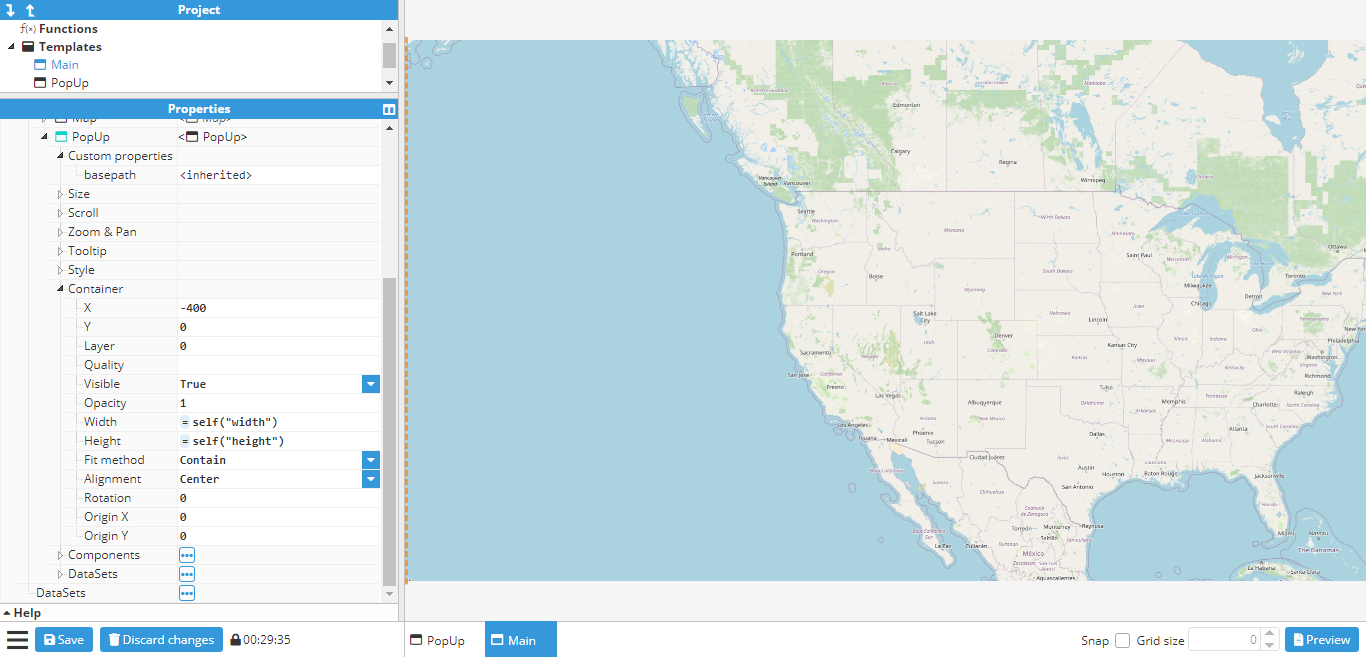
Once the popup is in place, markers can also be added to the map and events can start to be set up for opening the popup. Map markers are created for Madrid, Berlin, and London. After creating the markers, three actions need to be added to the click events for each marker:
- One action to set the **basepath** custom property to either Madrid, Berlin or London, depending on which marker was clicked upon.
- One action sets the **X** position of the popup to 0.
The event popup for the Madrid marker is shown in the following screenshot:
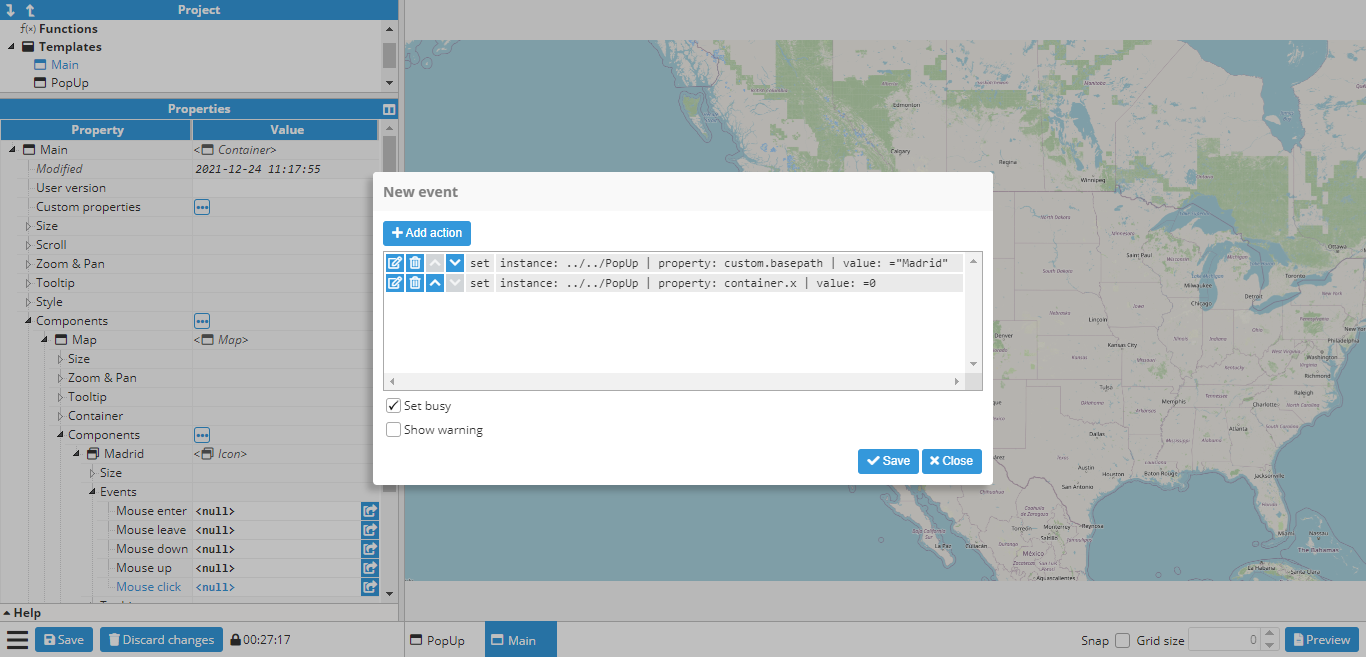
The same is done for the Berlin and London markers. To save time, since only one of the three actions needs to change, depending on the marker (the one that sets the custom property), this marker can be duplicated (CTRL+D after selecting the marker in the configuration window, or right-click and clicking the duplicate option) and the action deleted and created again with the new value.
The next stage is to test that everything works by clicking on a marker (either in preview mode or by using CTRL+Click while the marker is not selected). The different markers can now be clicked on to see if the value of the **basepath** changes accordingly. Finally, click the close button on the popup to ensure that it slides back off the screen.
## Creating a progress bar
By default, **Web Vision** only comes with a Gauge for displaying tag values, as well as any labels, which can also be linked to a tag. However, links can also be used to create custom components. In this example, a progress bar will be created and linked to a tag.
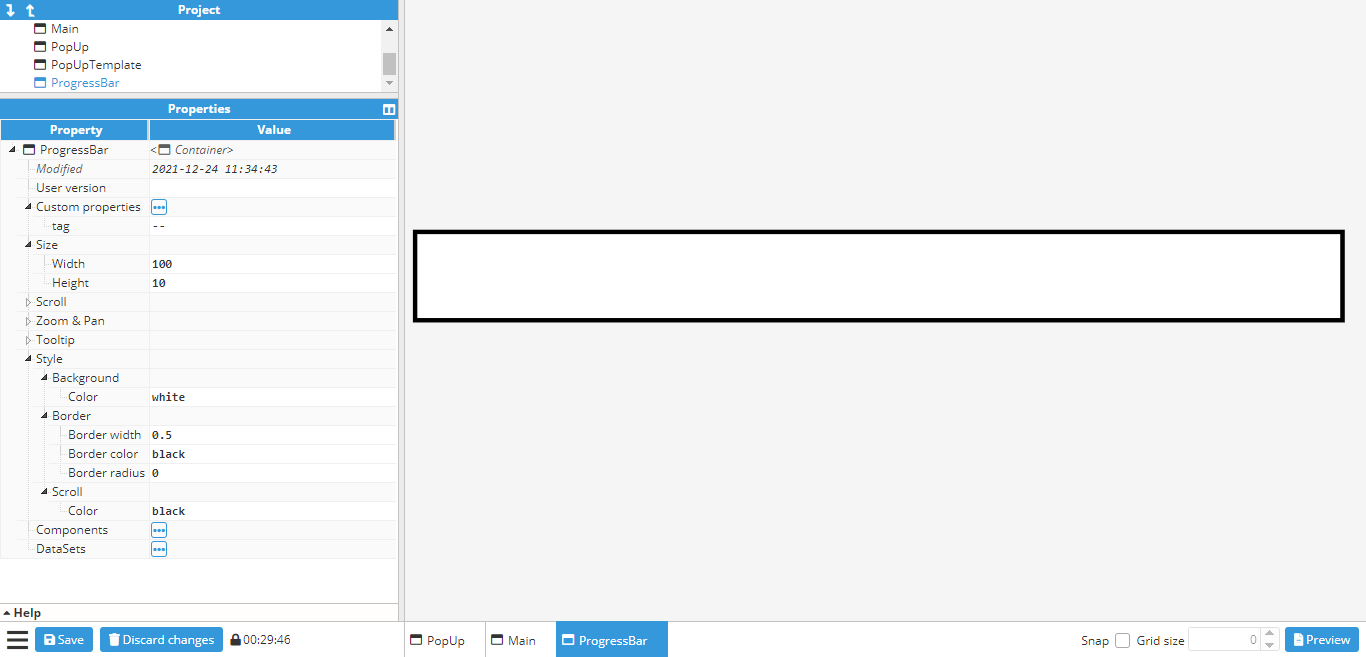
This first step is to create a new blank container. In this case, a 100x10 container is sufficient. Next, a custom property called **tag** is added to the container. This will be the tag that provides the value to the progress bar. Since this one will be a tag, the **tag picker control** will be used and limited to tag only.
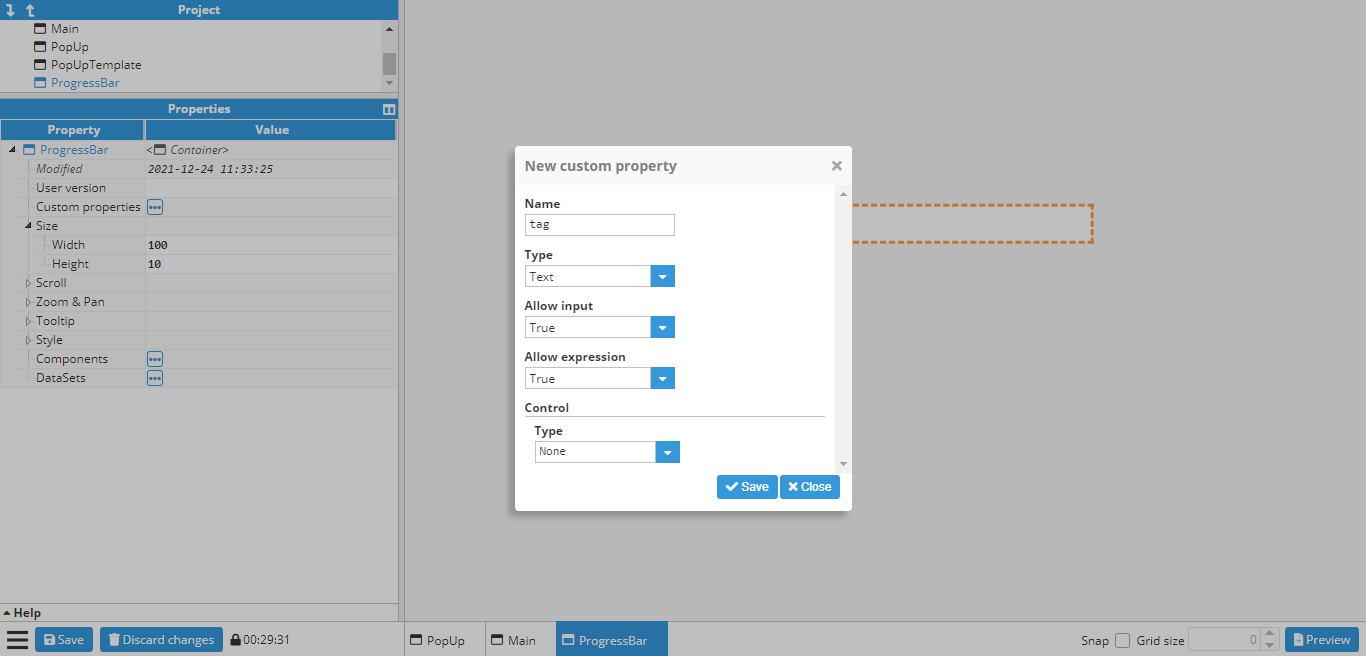
Afterward, a general styles border is added to the ProgressBar container.
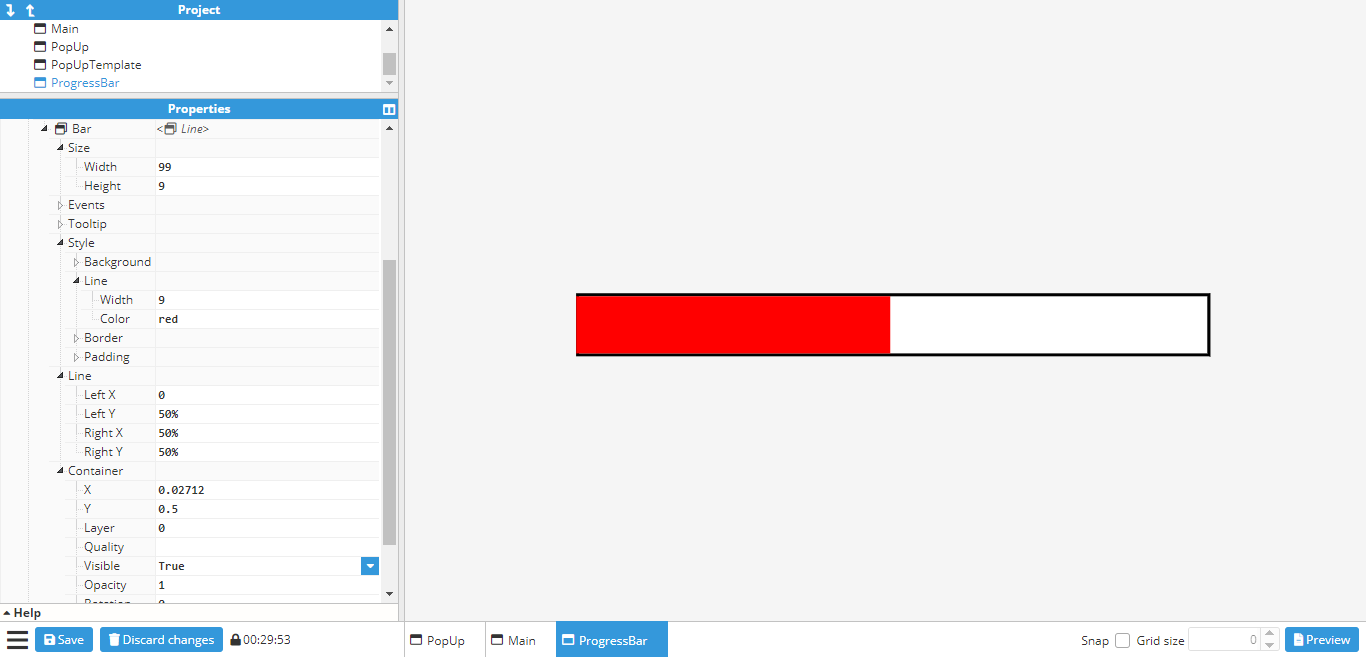
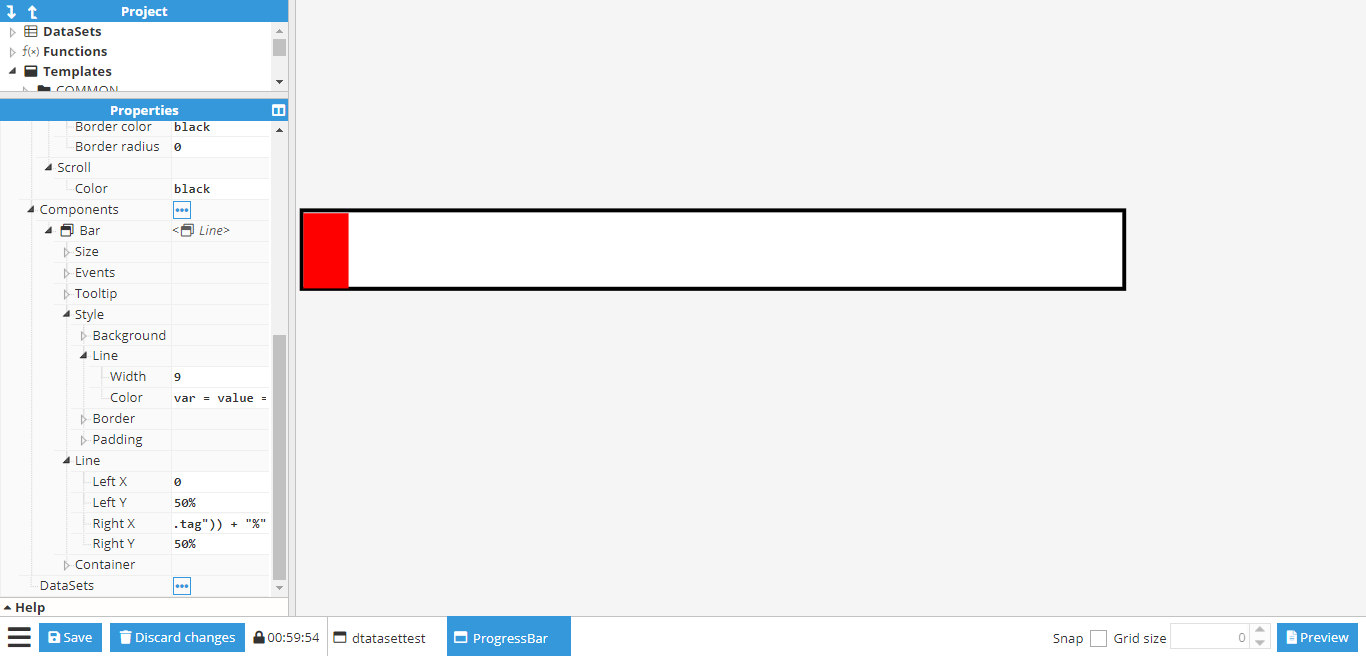
The next step is to create the progress bar itself. For this, a **line** component is used and set to a size of 99x9 (the same as the container, minus borders). The **line** **width** is also set to 9 in order to fill the entire container. The container X/Y is also set to 0.5 to avoid any overlapping with the border, which can be colored red (to contrast against the border) in order to make sure that the line has been positioned correctly. Its two points are then set to (0,0) and (50%,0), which gives the following result:
Finally, the **Right X** (the x coordinate of the line’s right-side point) needs to be linked to the newly created
tag custom property. For this, the following expression is used:
```javascript
=tag(parent(“custom.tag”)) + “%”
```
“%” is also added to the end of the expression in order to transform the second point into a relative value, instead of an absolute one. The value of the **tag** custom property can be changed to a tag in order to ensure that the setup has been carried out correctly. In this example, “/ReadOnlyNumber” is used. If the line changes when the value changes, the progress bar is working as intended.
While this is enough for a working progress bar, it can also be configured in a way that the colors change according to the tag value. Animations can also be added for smoother transitions between each change in values.
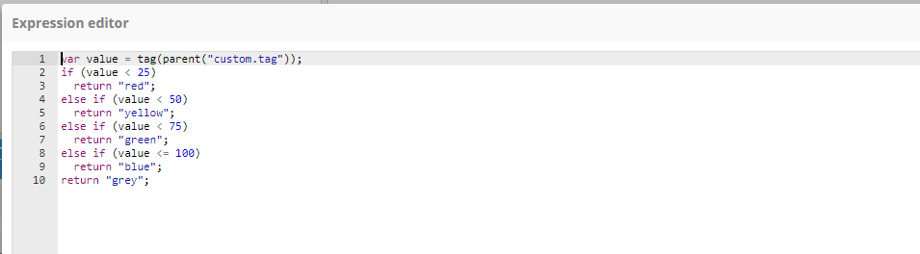
First of all, it’s configured to **change color** from **red** when below 25, **yellow** until 50, **green** until 75 and finally to **blue**. To do this, a conditional expression needs to be added to the line **color** property by using the **expression editor** helper to make it easier to input the expression:
If the expression is written correctly (no syntax errors), users can check that the colors work by changing the tag value:
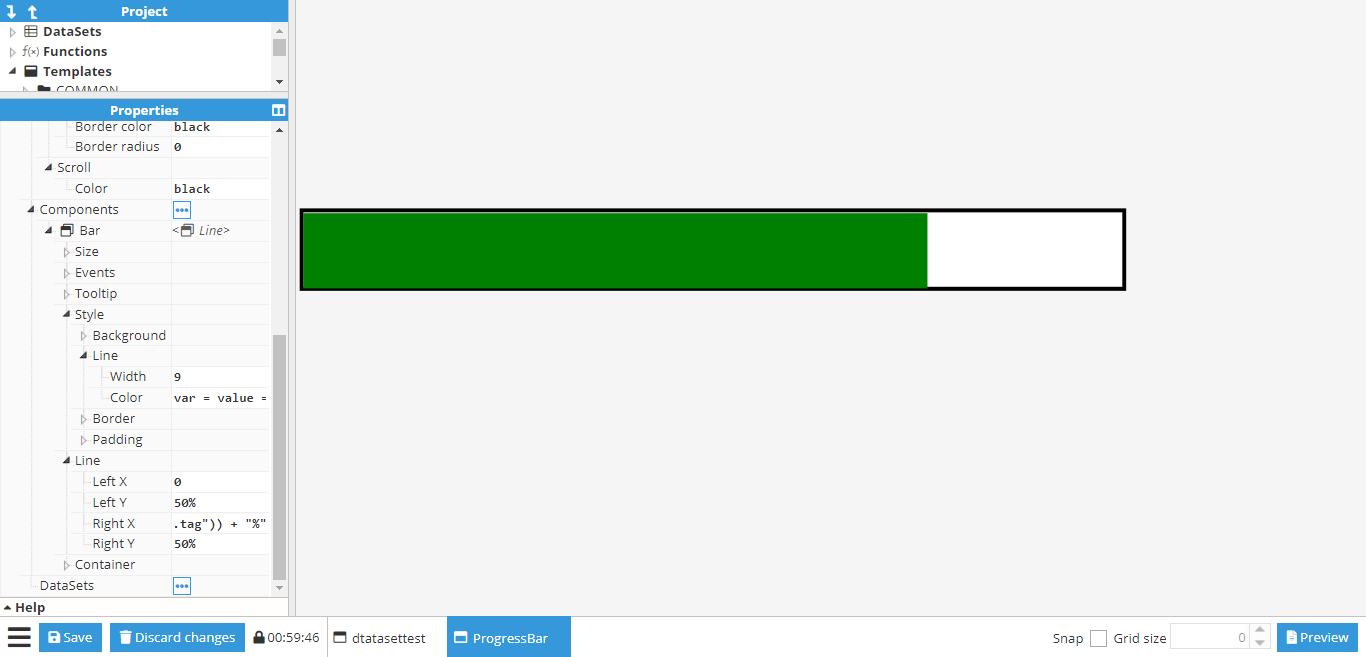
Finally, an animation can be added to the Right X coordinate for a smoother transition between values. To do so, the **Set animation** helper can be used on the Right X” coordinate to input the animation settings. Once configured, the icon next to Right X should indicate that the animation is enabled. More information about animations can be found in the animation section.
## [](/v121/docs/web-vision-examples#_Toc63160055)
## [](/v121/docs/web-vision-examples#_Toc63160050)Using SVG component for custom components
**SVG custom components** offer a powerful means to incorporate **Scalable Vector Graphics** (SVG) images onto the screen. This format is highly convenient, as it allows for gradual resizing while preserving image quality. Moreover, the abundance of SVG graphics available online eliminates the need for users to create them from scratch.
To import an SVG into the project, users have two options:
1. Utilize the [Image component](https://docs.n3uron.com/docs/en/web-vision-visual-elements?highlight=undefined#image): Simply import the SVG image directly, just selecting the image you want to import from without the need for additional code manipulation.
2. Employ the [SVG component](https://docs.n3uron.com/docs/en/web-vision-visual-elements?highlight=undefined#svg): This option provides advanced functionality, allowing users to manipulate SVG attributes using CSS, XML, and JavaScript to customize the graphic to their specific requirements.
In this example, we will explain the second option, using the SVG component. For instance, we are going to create an SVG component that represents a PUMP and its internal state. 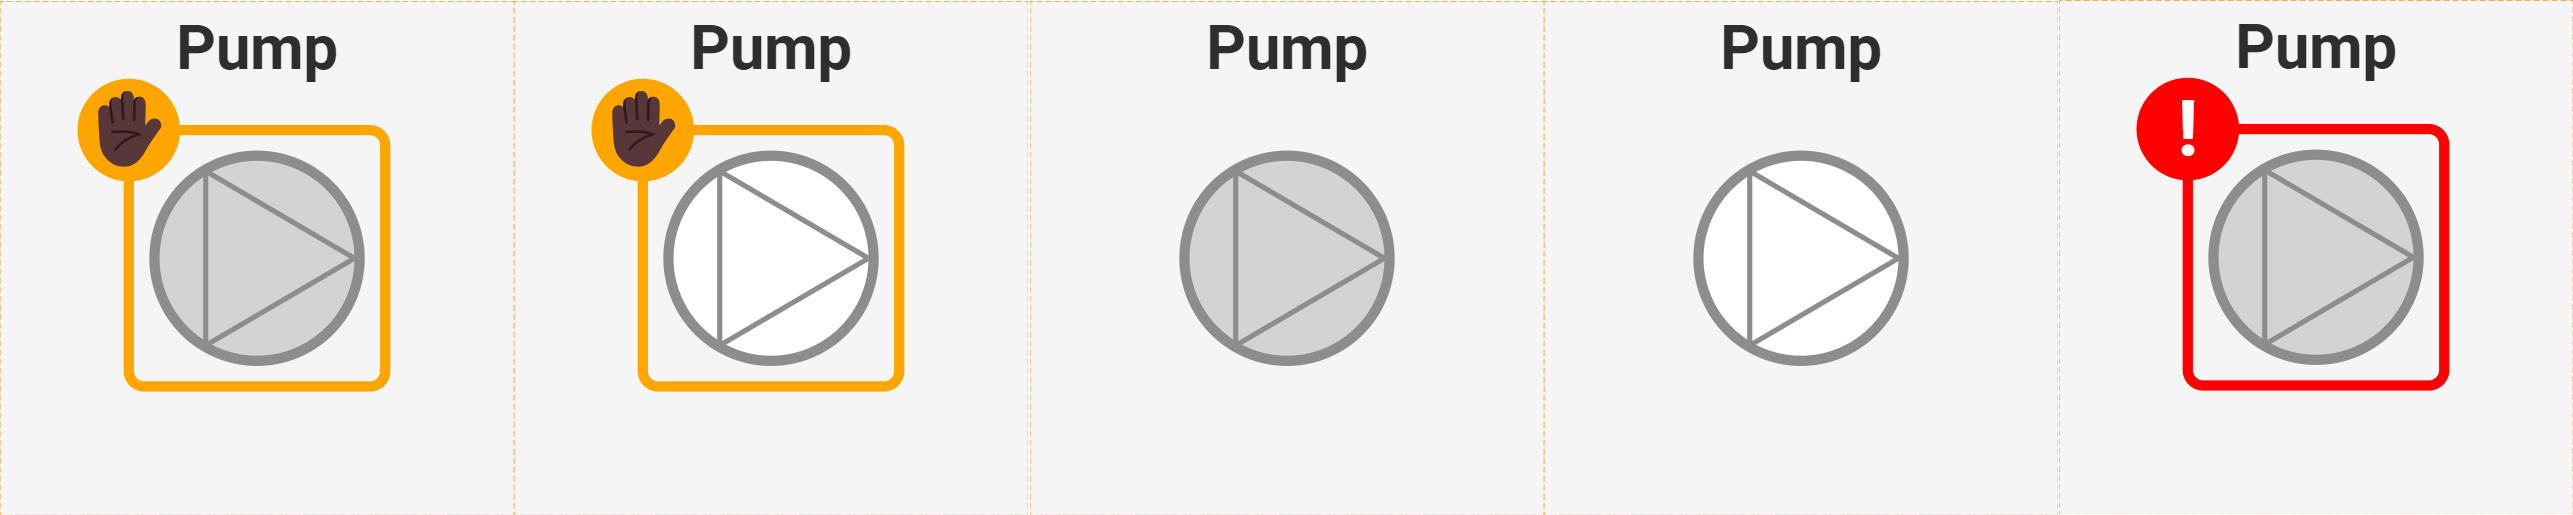
SVG is a markup language based on XML, so its structure follows XML conventions. Here is the code for this particular example:
```markup
```
The following is a detailed explanation of the code:
1. **