WebUI Historical data interface
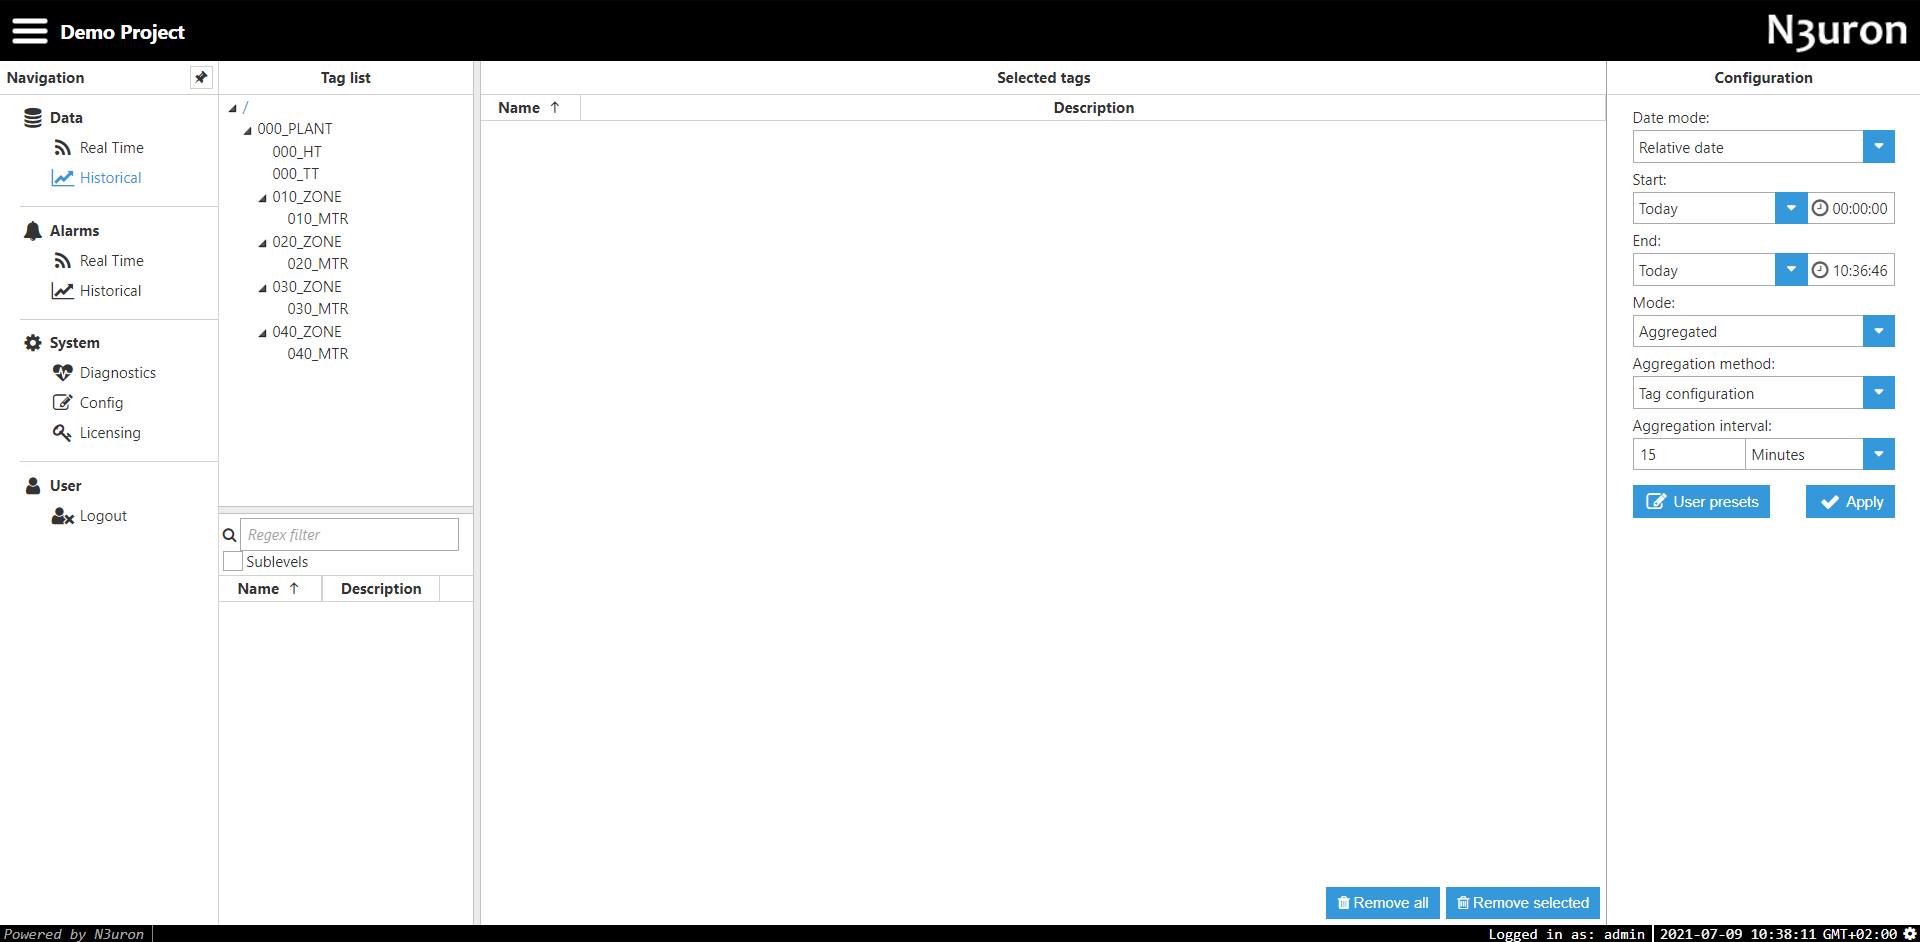
WebUI historical data interface is a rich HTML5 interface used for visualizing historical data. This section of N3uron allows users to configure various parameters in order to monitor the historical data of selected tags. Figure 20: WebUI Historical data interface
The following properties can be configured:
- Tag list: a tree menu that shows all available historized tags. In order to visualize a tag’s historical data, drag and drop the tags in the Selected tags area.
- Configuration: Visualization parameters available in Configuration area:
- Date mode: Allows for different ways of specifying the start and end dates for displayed data.
- Relative: Allows users to select the start and end date according to the current date.
- Absolute: Allows users to select a start and end date as absolute dates.
- Current: Allows users to select an interval between the current moment and a previous moment defined by the offset.
- Date: Configuration for the different Date modes:
- Relative: Start and end dates are configured using an offset in days or weeks and a time offset in milliseconds
- Offset: Offset relative to current moment.
- Time: Absolute offset over the relative offset.
- Absolute: Allows dates to be specified as absolute values.
- Start: Absolute start date.
- End: Absolute end date.
- Current: Allows the date to be specified between a selected negative offset and the current moment.
- Offset: Negative offset from current date.
- Units: Offset units (seconds, minutes, or hours).
- Relative: Start and end dates are configured using an offset in days or weeks and a time offset in milliseconds
- Mode: Configuration of data representations.
- Aggregated: Allows users to aggregate data using different methods.
- Raw: Presents data as per how it is stored in the historical database.
- Delta: Only presents values when they have changed more than the deadband value. Includes all values after the change.
- Filter: Only presents values when they have changed more than the deadband value. Includes all values before and after the change.
- Mode configuration: Configuration properties for the different modes.
- Aggregated:
- Aggregation method: Aggregation type applied to the data. Choose between:
- Tag configuration: Value configured within the tag.
- Avg: Weighted-time average for the selected aggregation interval.
- Min: Minimum value for the selected aggregation interval.
- Max: Maximum value for the selected aggregation interval.
- First: First value for the selected aggregation interval.
- Last: Last value for the selected aggregation interval.
- Aggregation method: Aggregation type applied to the data. Choose between:
- Aggregation interval: Interval for the aggregated data:
- Value: Interval value.
- Units: Value units.
- Raw: No special configuration, raw values.
- Delta and Filter:
- Deadband: Defines the data change threshold.
- Aggregated:
- User presets: Configuration properties can be saved as presets. Previously saved presets can be loaded via this parameter.
- Date mode: Allows for different ways of specifying the start and end dates for displayed data.
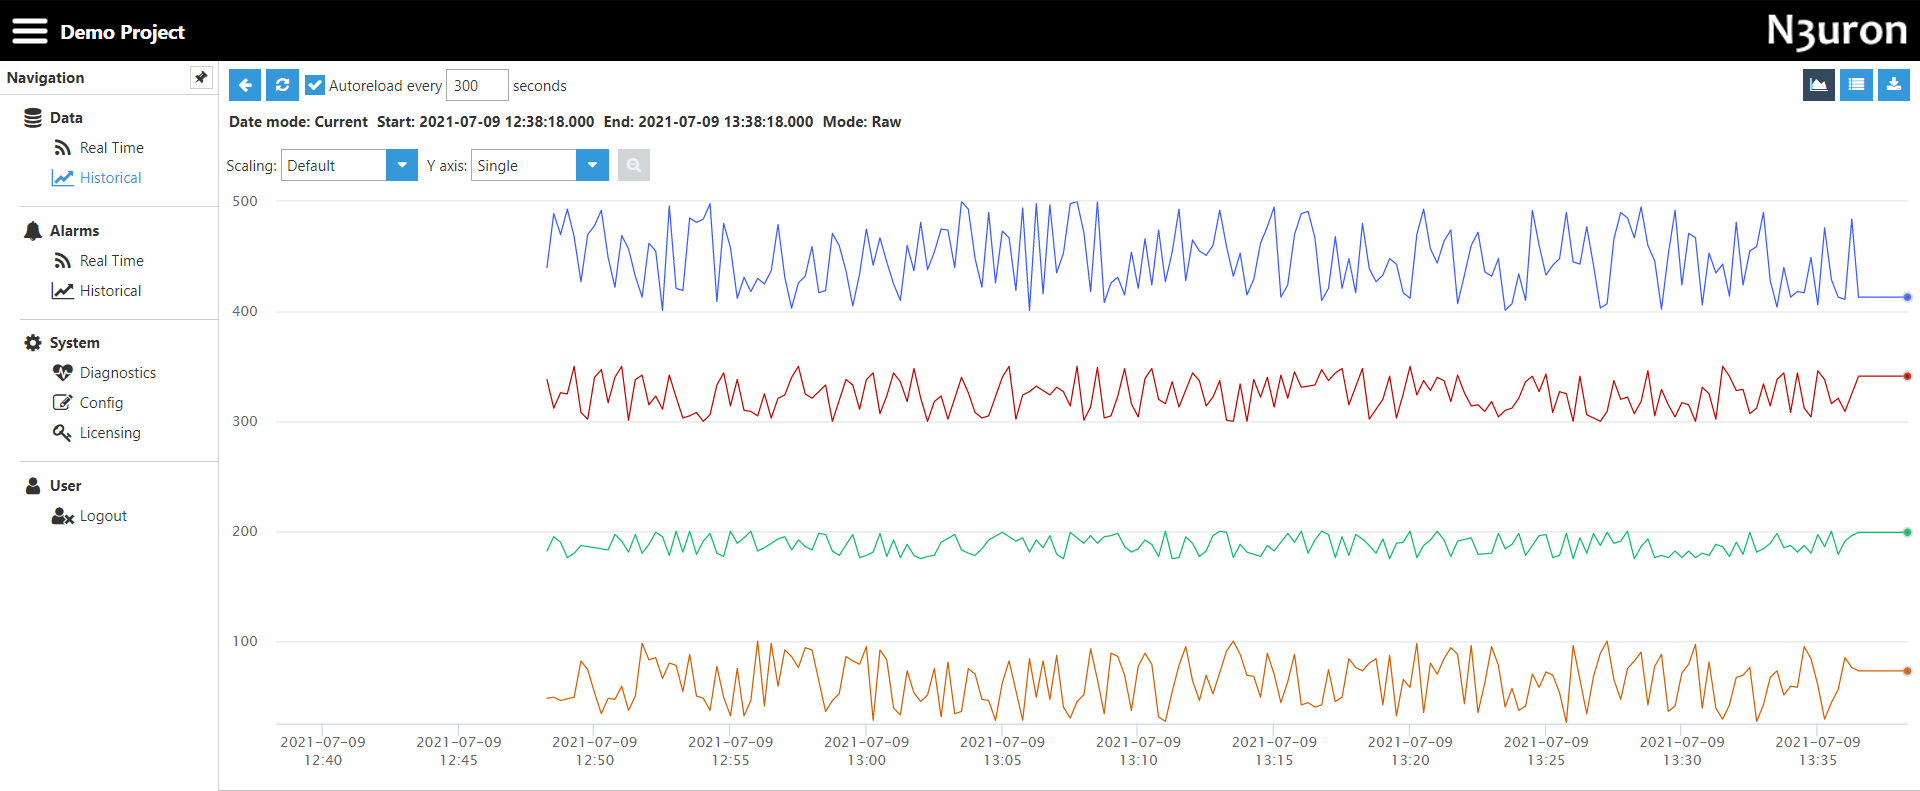
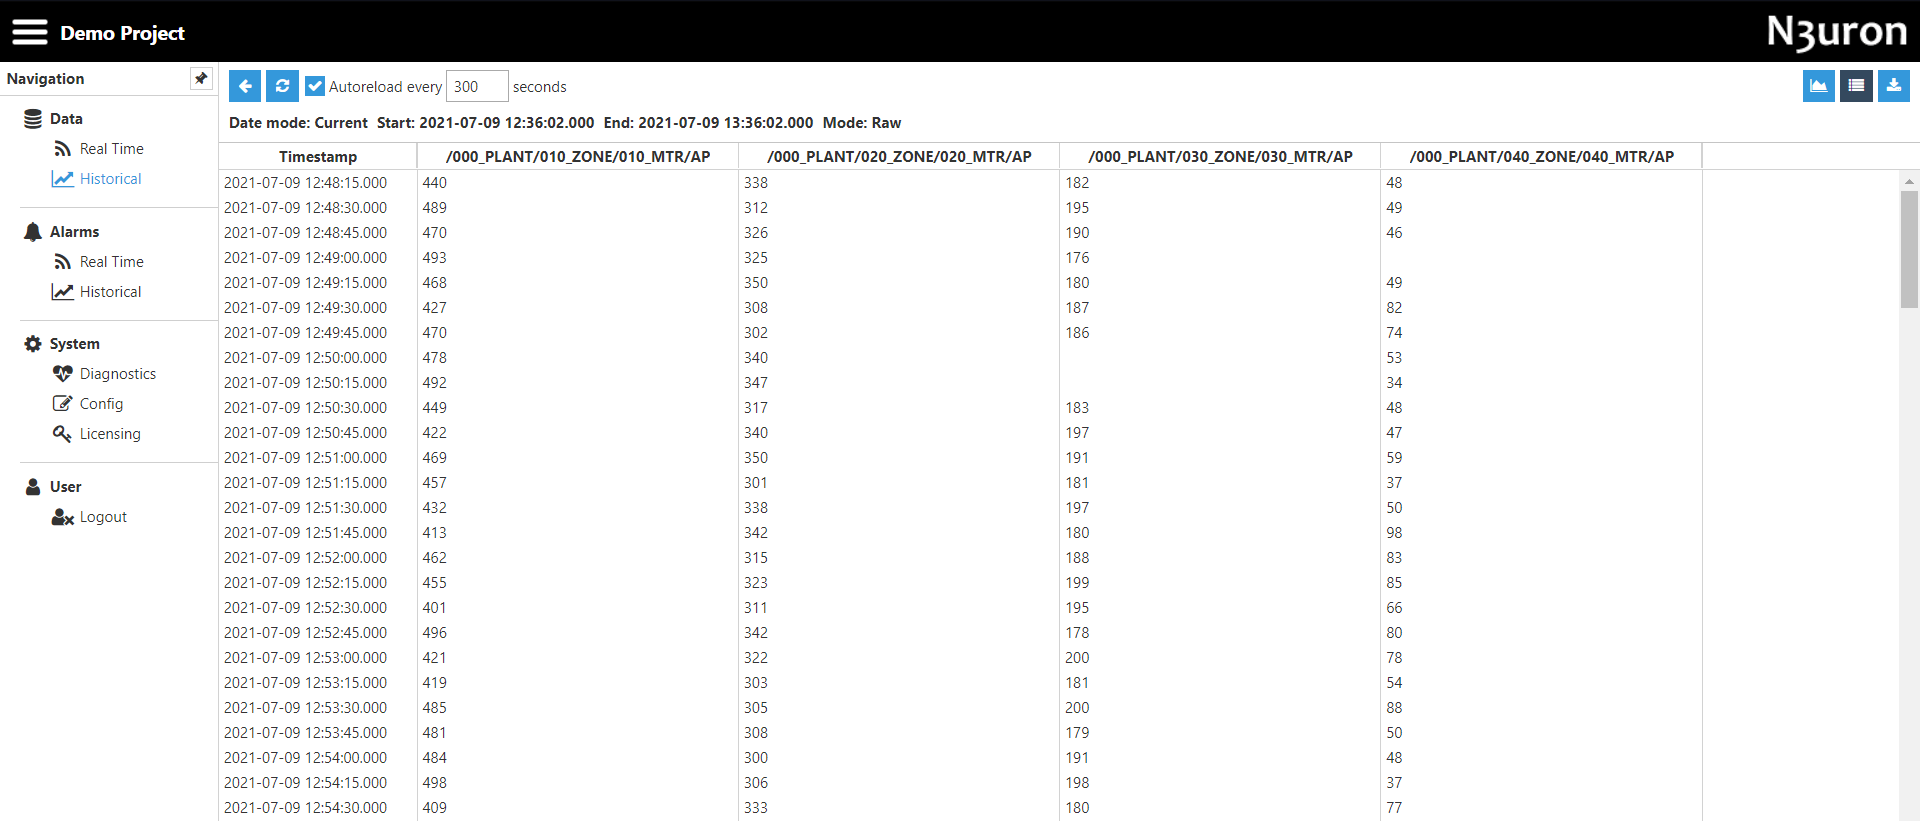
After applying the retrieval parameters in Configuration, the WebUI shows the historical data of the selected tags with the following options:
- Autoreload: Enables a periodic reload of the data.
- Return to configuration view.
- Reload selected tags.
- Download: Downloads a CSV file containing historical data.
- Data visualization: Data can be visualized in two ways: a chart or a table with date/value representation.

Figure 21: Chart
 Figure 22:Table