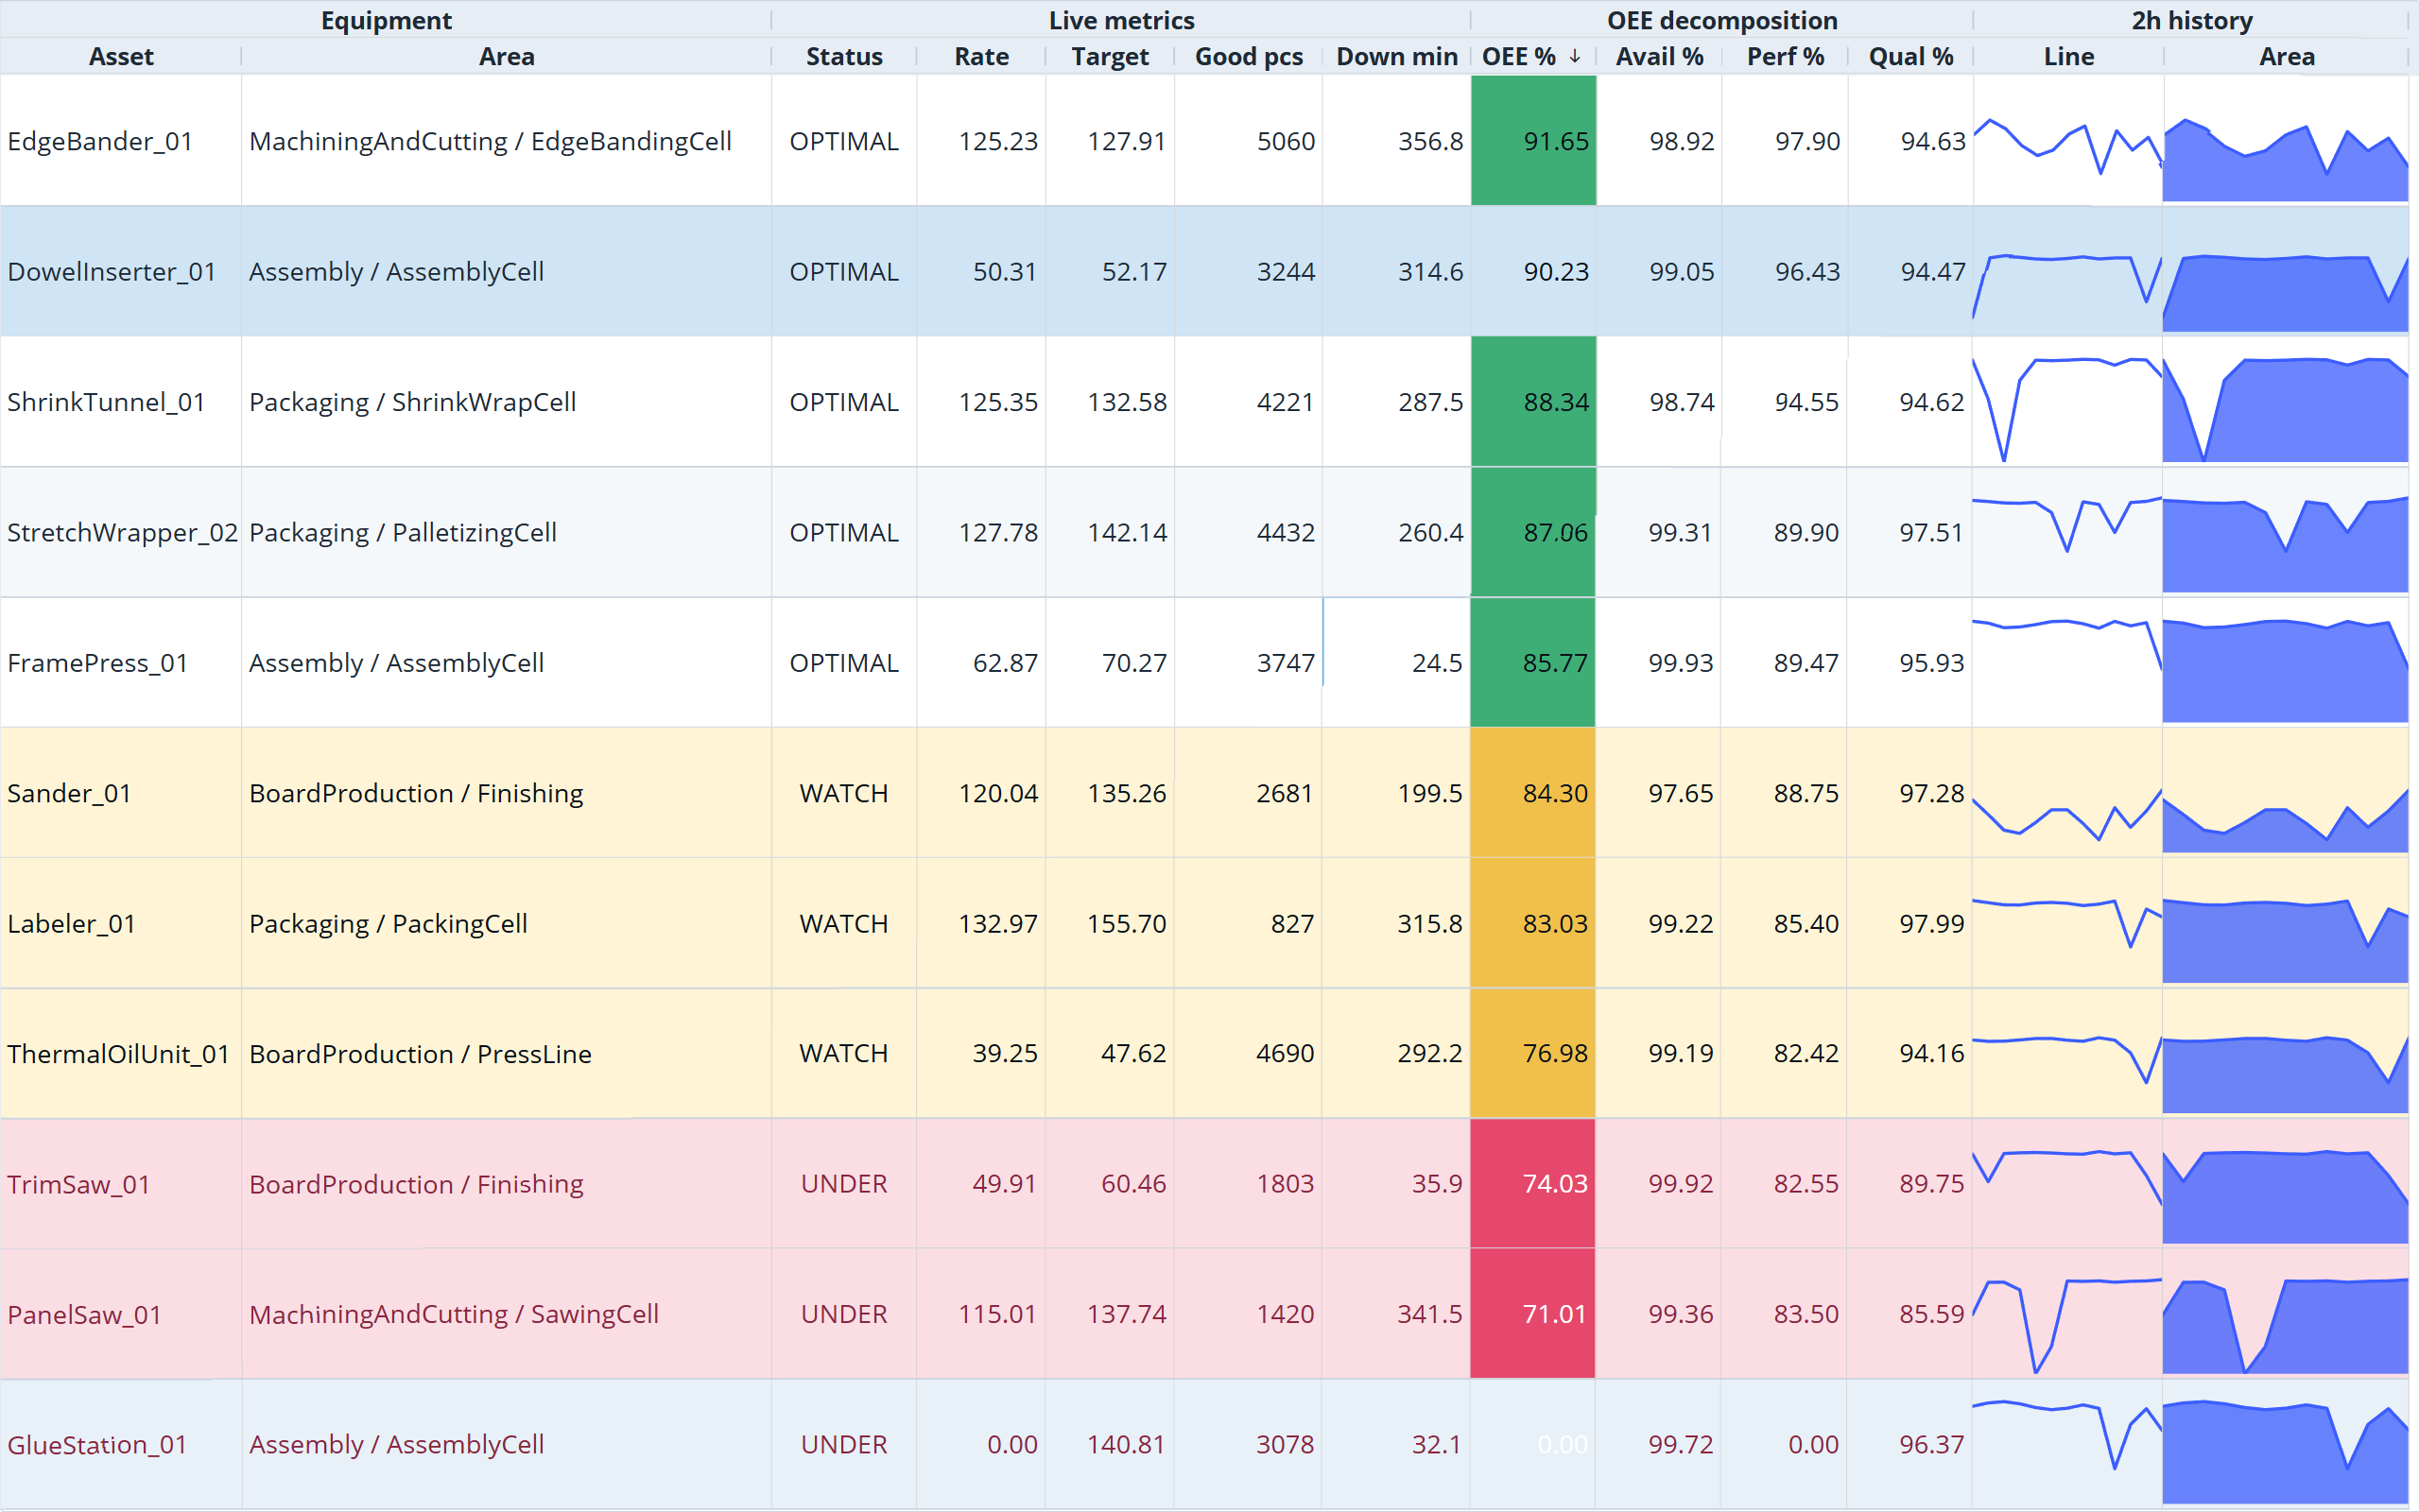
This example builds a live equipment table with one row per machine, numeric KPI columns grouped under shared headers, a color-coded status, and two inline sparklines. The Data property holds one expression that returns a list, and each item in the list becomes one row. The row below is trimmed to the fields explained here; the full template also carries availability, performance, quality, target, and good:
[
 {
  asset: "FramePress_01",
  area: "Assembly / AssemblyCell",
  status:(tag("/Acme/Plant01/Production/Assembly/AssemblyCell/FramePress_01/oee/OEE.data.value")>=85?"OPTIMAL":(tag("/Acme/Plant01/Production/Assembly/AssemblyCell/FramePress_01/oee/OEE.data.value")>=75?"WATCH": "UNDER")),
  oee:tag("/Acme/Plant01/Production/Assembly/AssemblyCell/FramePress_01/oee/OEE.data.value"),
  availability:tag("/Acme/Plant01/Production/Assembly/AssemblyCell/FramePress_01/oee/Availability.data.value"),
  performance:tag("/Acme/Plant01/Production/Assembly/AssemblyCell/FramePress_01/oee/Performance.data.value"),
  quality:tag("/Acme/Plant01/Production/Assembly/AssemblyCell/FramePress_01/oee/Quality.data.value"),
  rate:tag("/Acme/Plant01/Production/Assembly/AssemblyCell/FramePress_01/metric/Rate.data.value"),
  target:tag("/Acme/Plant01/Production/Assembly/AssemblyCell/FramePress_01/metric/TargetRate.data.value"),
  good:tag("/Acme/Plant01/Production/Assembly/AssemblyCell/FramePress_01/metric/GoodCount.data.value"),
  total:tag("/Acme/Plant01/Production/Assembly/AssemblyCell/FramePress_01/metric/TotalCount.data.value"),
  downtime:tag("/Acme/Plant01/Production/Assembly/AssemblyCell/FramePress_01/maintenance/Downtime_min.data.value"),
  q:tag("/Acme/Plant01/Production/Assembly/AssemblyCell/FramePress_01/oee/OEE.data.quality"),
  ts:tag("/Acme/Plant01/Production/Assembly/AssemblyCell/FramePress_01/oee/OEE.data.ts"),
  trend:dataset("Hist_FramePress"),
  spark:dataset("Hist_FramePress")
  },
  // ... one object per machine
]
Each row is a set of key: value pairs. The key (asset, oee, trend, …) is a name you choose and is what a column's Field points to; the value is what the cell shows. Values can be fixed text, a live tag read with tag(), a calculated expression (the ternary operator ? : is shorthand for "if / otherwise"), or a historical dataset from dataset() that a column draws as a mini-chart.
This image from the Data→Realtime screen displays the structure of the tag model: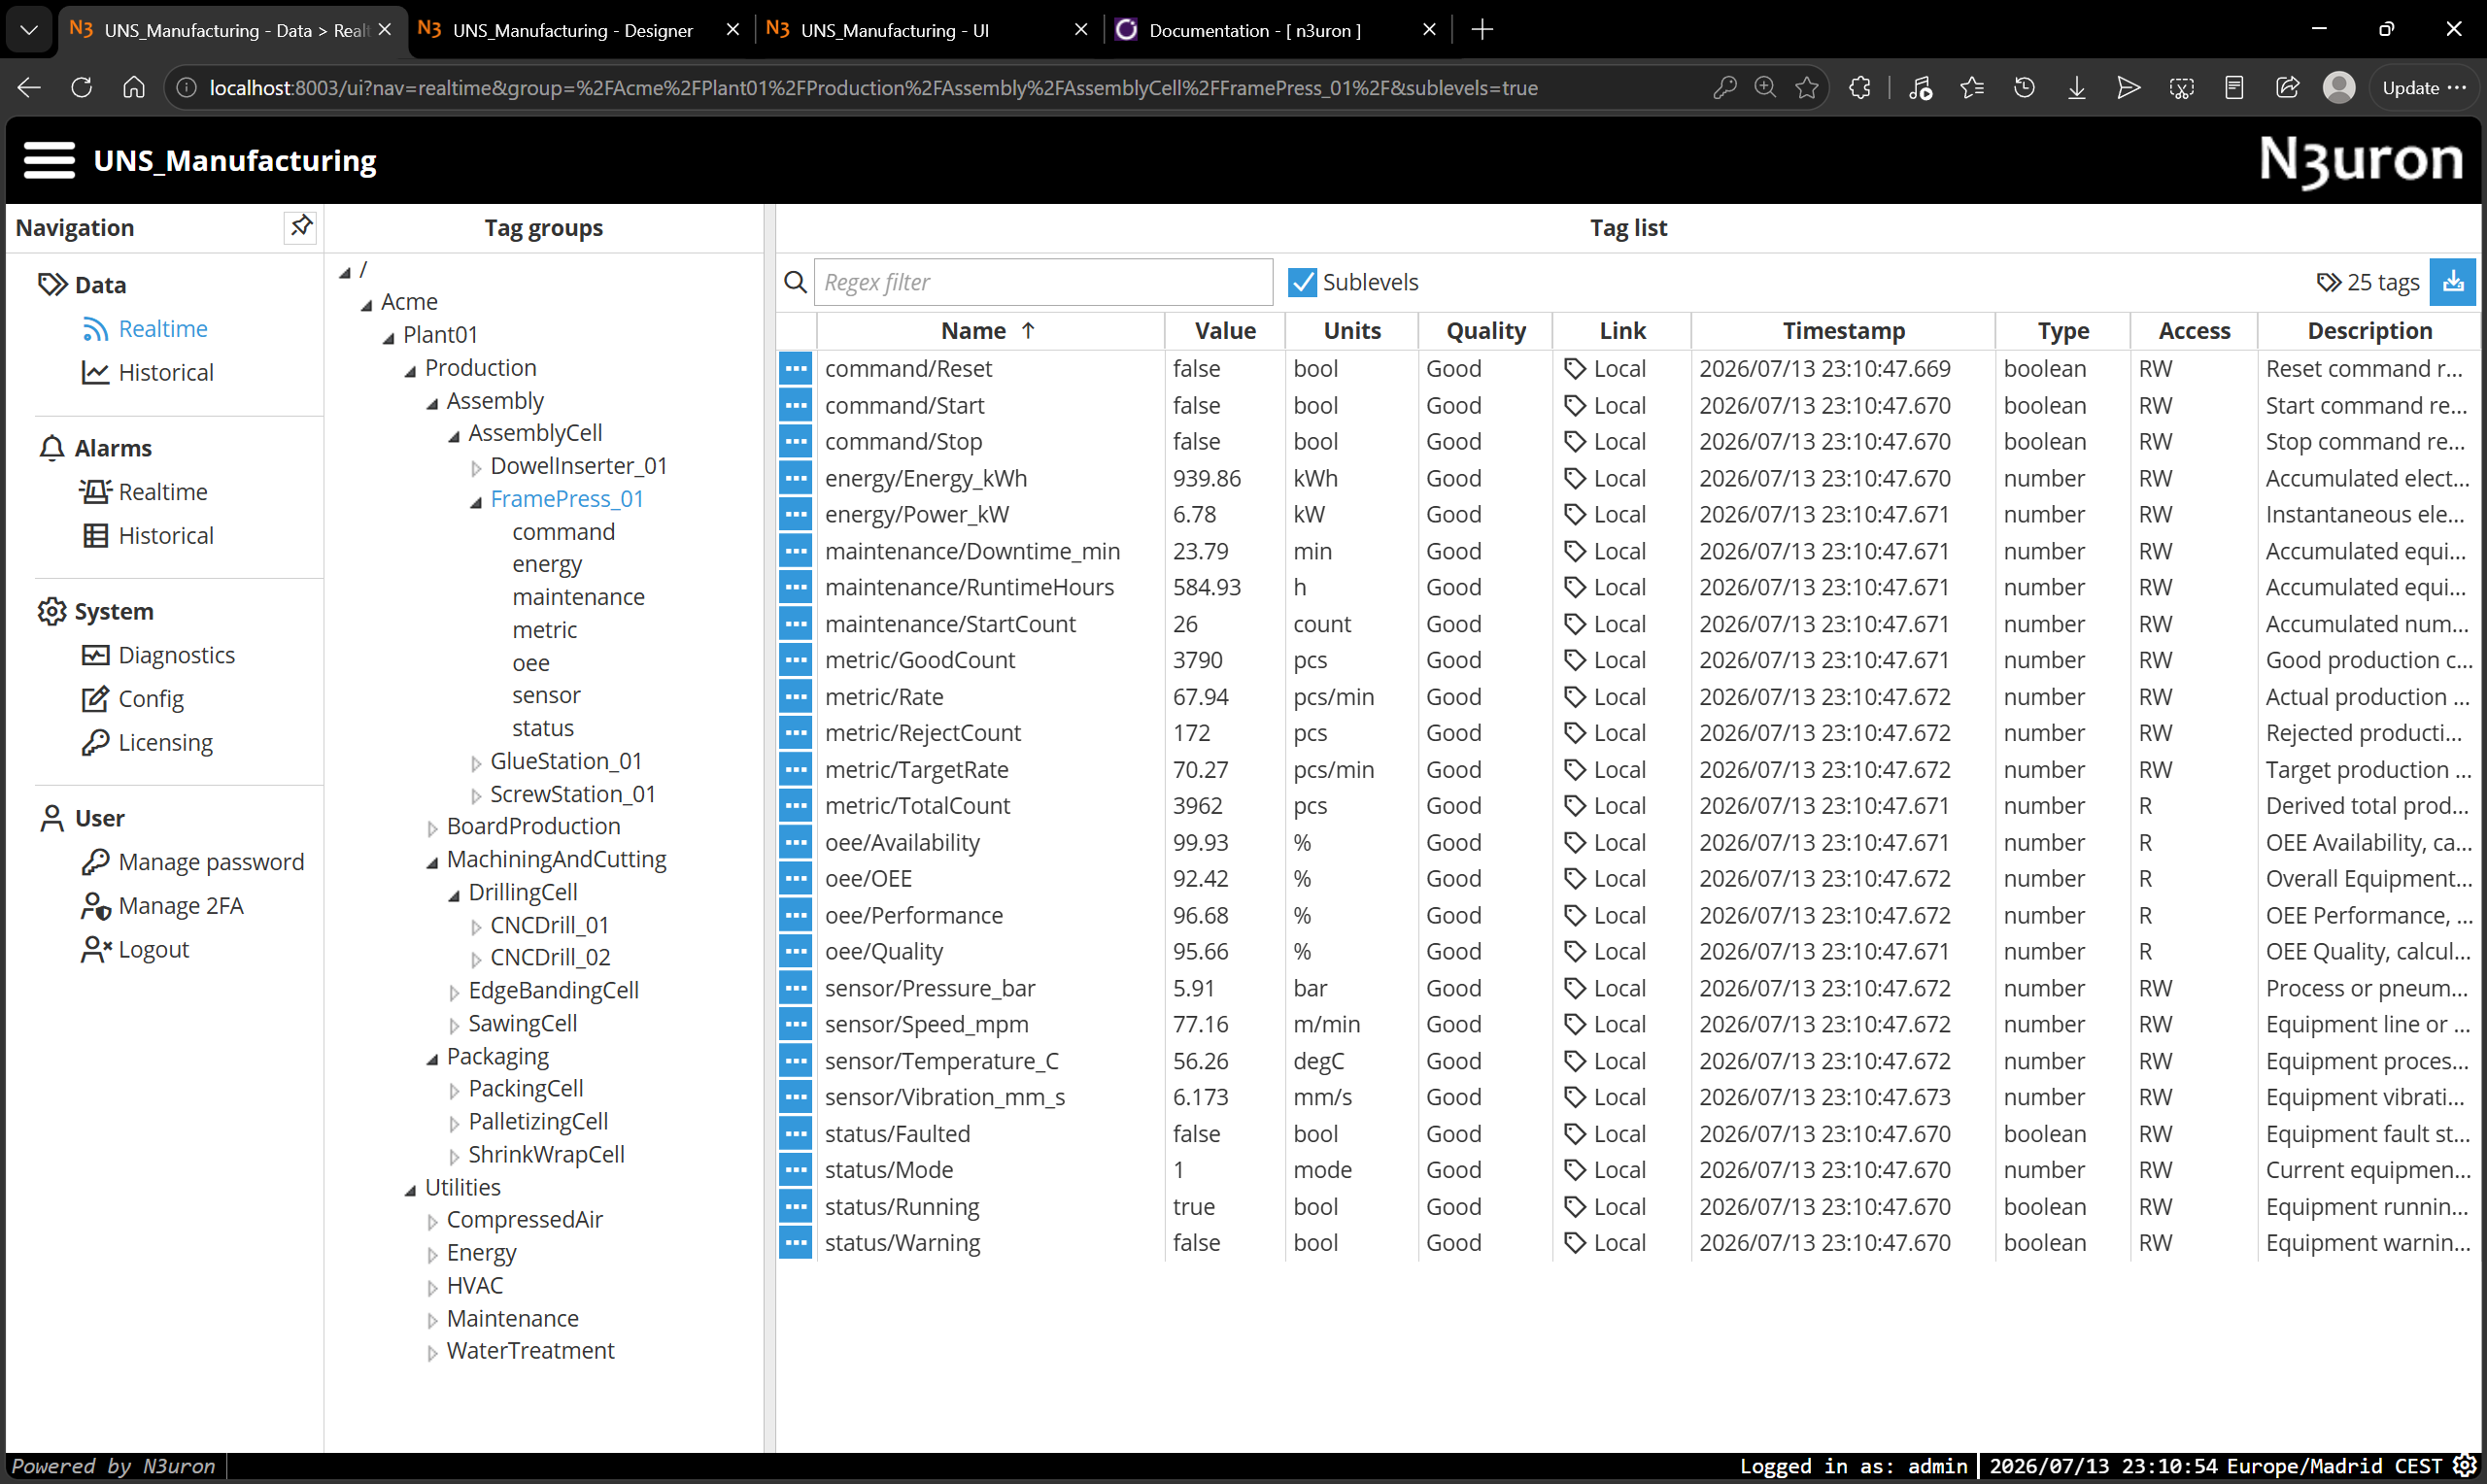
Step-by-step configuration
Add a Dataset Table component to the template.
In Table → Data, paste the expression that returns the array of rows (shown above).
Set Table → Row key to asset (the field that is unique for every row). This keeps each sparkline bound to the correct row after sorting.
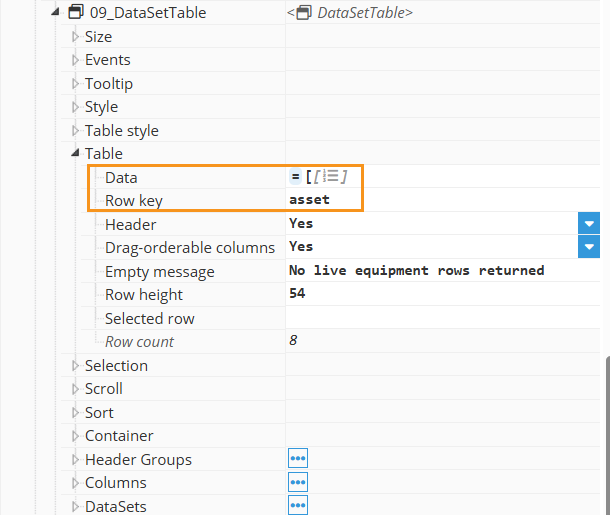
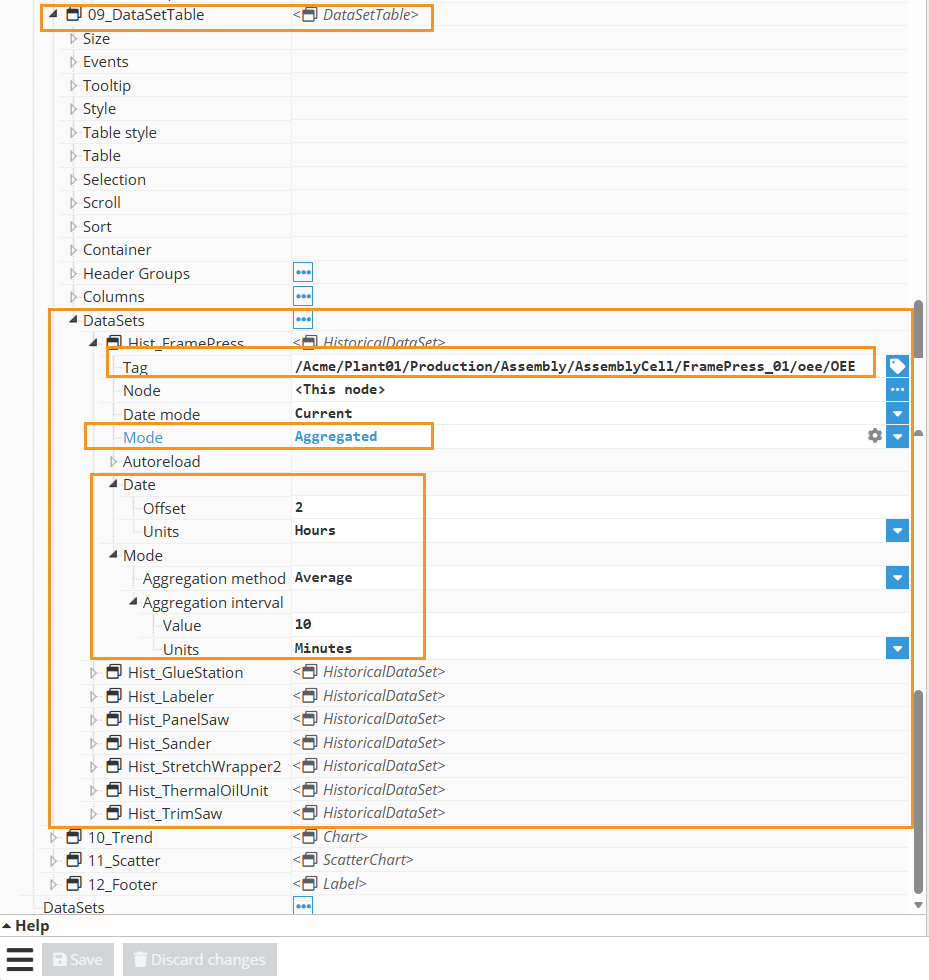
Under DataSets, create one historical dataset per machine (e.g. Hist_FramePress) that the sparklines will use: Tag = the machine's OEE tag, Node = This node, Date mode = Current (2 hours), Mode = Aggregated (Average, 10 minutes), and Autoreload = 300 s.
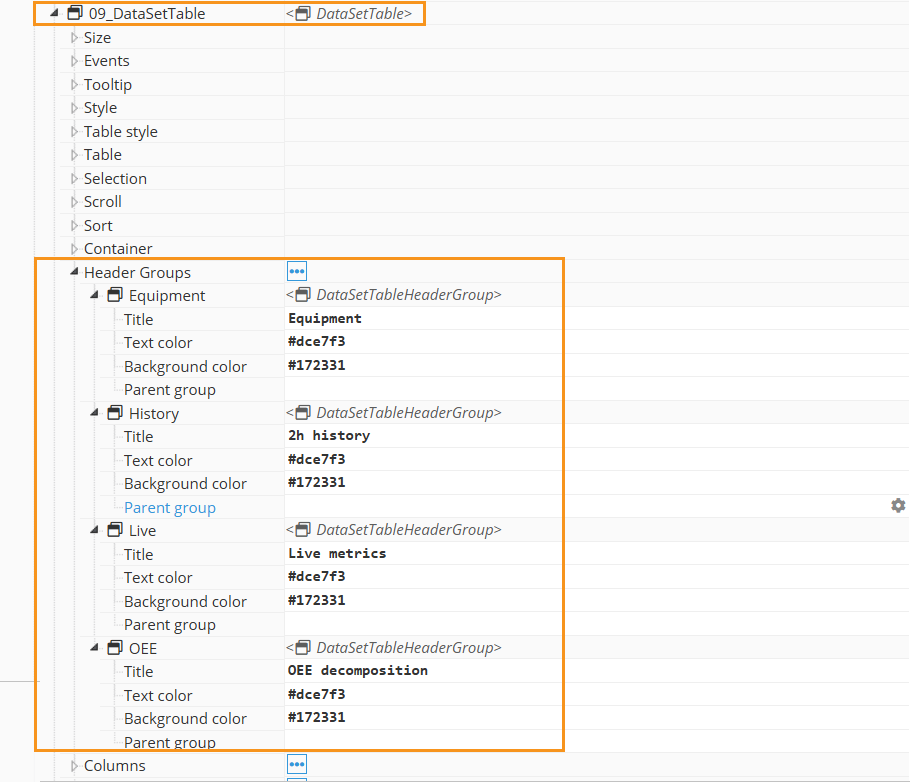
Under Header Groups, create four groups (leave Parent group blank so they are top-level): Equipment, Live metrics, OEE decomposition, and 2h history.
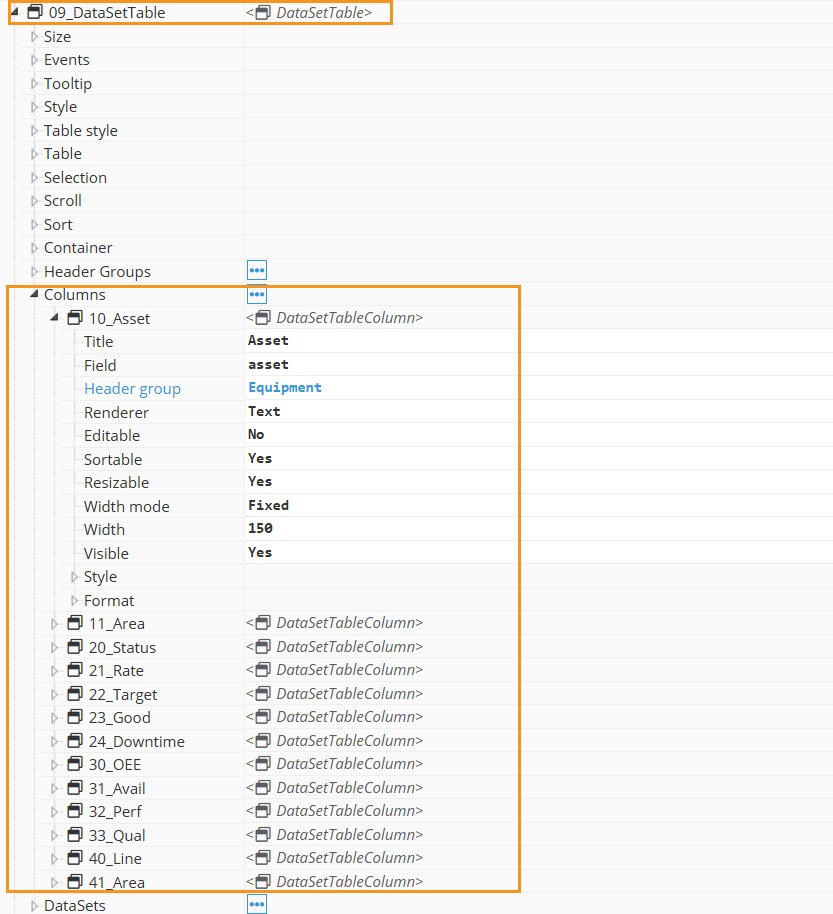
Under Columns, add one column per value, mapping each column's Field to a label in the data and assigning its Header group, Renderer, and format:
Title
Field
Header group
Renderer
Format / Chart
Width
Asset
asset
Equipment
text
%s
150
Area
area
Equipment
text
%s
205
Status
status
Live metrics
text
%s (+ Row & Cell color)
90
Rate
rate
Live metrics
text
%.2f
80
Target
target
Live metrics
text
%.2f
80
Good pcs
good
Live metrics
text
%i
92
Down min
downtime
Live metrics
text
%.1f
92
OEE %
oee
OEE decomposition
text
%.2f
78
Avail %
availability
OEE decomposition
text
%.2f
78
Perf %
performance
OEE decomposition
text
%.2f
78
Qual %
quality
OEE decomposition
text
%.2f
78
Line
trend
2h history
sparkline
line, window 24
145
Area
spark
2h history
sparkline
area, window 24
145
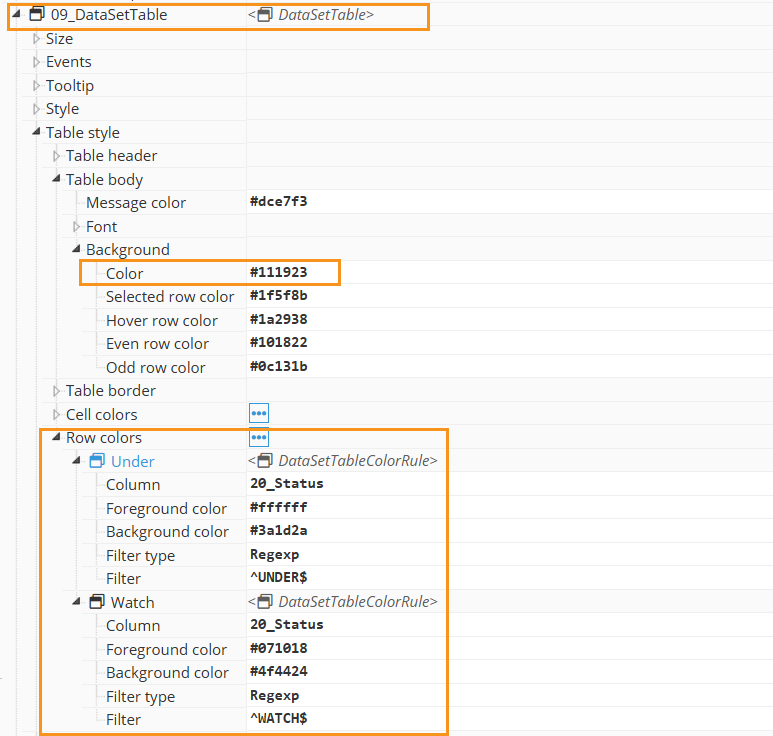
On the Status column, add Row & Cell color filters so OPTIMAL, WATCH, and UNDER each get their own color. OPTIMAL will get the default background color.
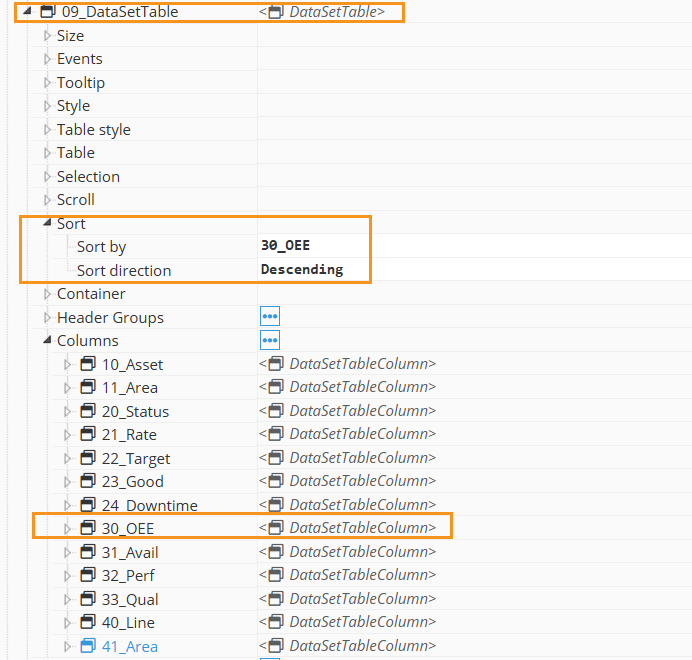
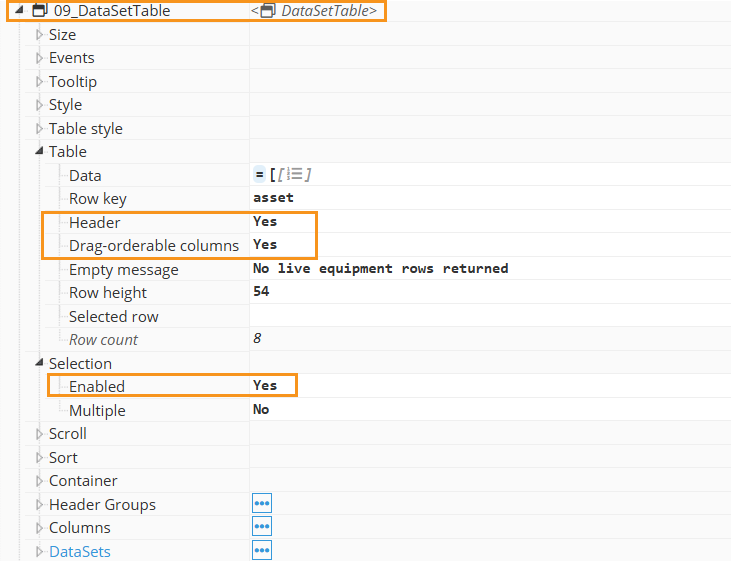
Under Sort, set Sort by = OEE % and Sort direction = Descending. Set Row height = 54 and enable Selection, Header, and Drag-orderable columns as desired.
The result is a live, sortable OEE table where the numeric cells and the two sparklines refresh on their own as the tags update and the historical datasets autoreload.