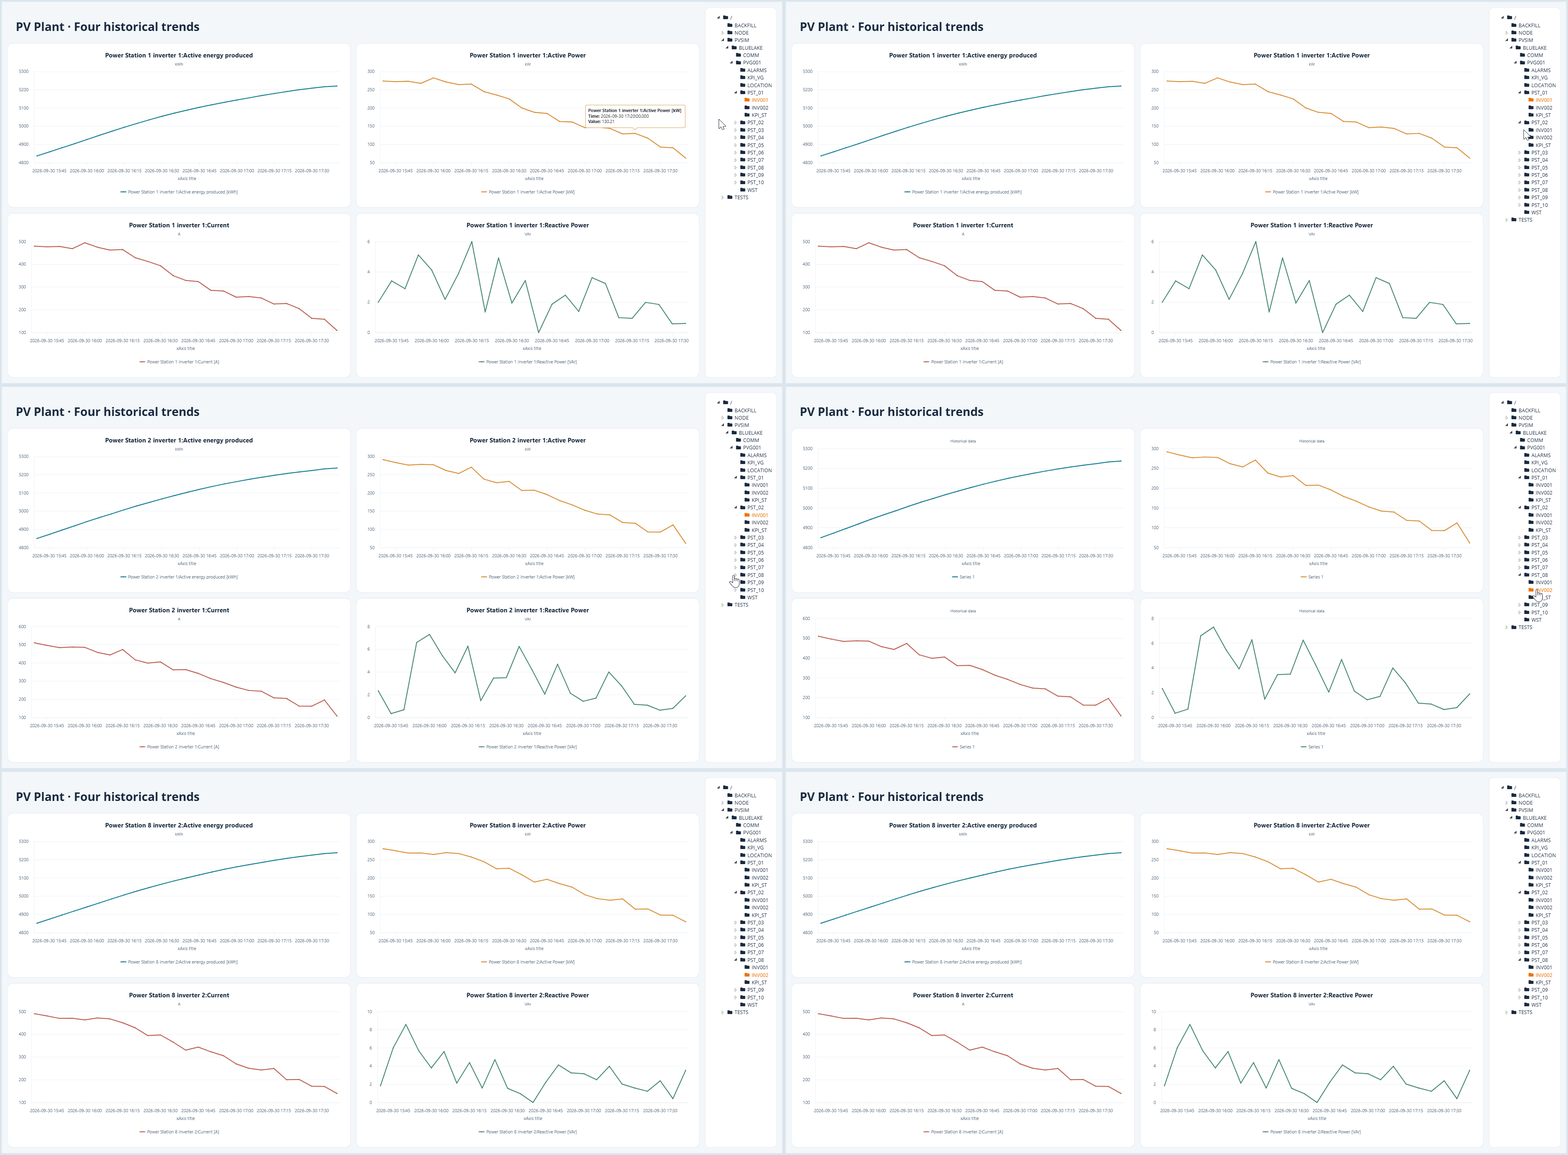
Screen managed by TagPicker
In this example, all chart instances are controlled by a TagPicker element, using property references to control the different values, tag reads and properties along the project that refers to the tag selected by the user. The purpose is to describe the values flowing from a template instance into its custom properties and then into nested elements.
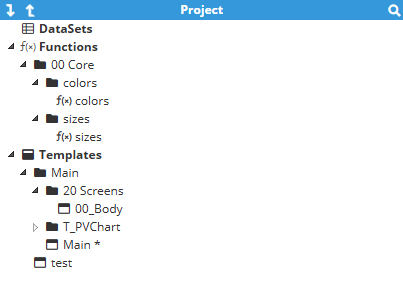
The project contains a Main screen, a 00_Body dashboard template, four instances of T_PVChart, and the colors and sizes Functions.
Property flow in the example
The Main screen contains a TagPicker named 10_TagPicker. Its selected path is linked to the ElementPath custom property of the 00_Body instance:

property("../30_TagPicker.selected")The dashboard uses ElementPath as a common base path. Each T_PVChart instance adds the name of one historical Tag to set its own tagPath. For example:
property("../../.custom.ElementPath") + "ACTIVE_ENERGY"
|
|
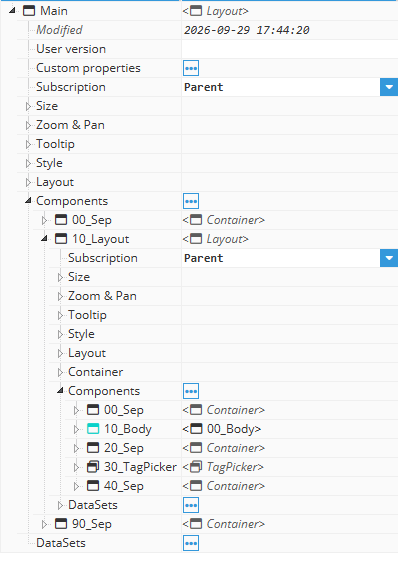
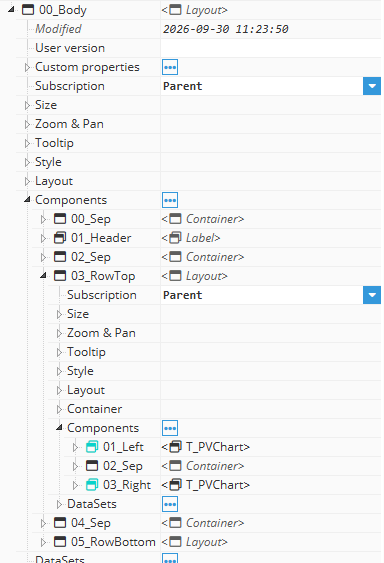
Chart instance | Tag suffix |
|---|---|
Top left |
|
Top right |
|
Bottom left |
|
Bottom right |
|
How T_PVChart uses its custom properties
The reusable T_PVChart template declares tagPath, title, unit, windowHours, aggregationMinutes, aggregationMethod, and seriesColor. Each instance can supply its own values while retaining the same chart structure.
Title and engineering units
On the chart template root, self() reads its own custom properties. The default expressions derive the title and unit from the Tag configuration:
tag(self("custom.tagPath") + ".config.description")
tag(self("custom.tagPath") + ".config.engUnits")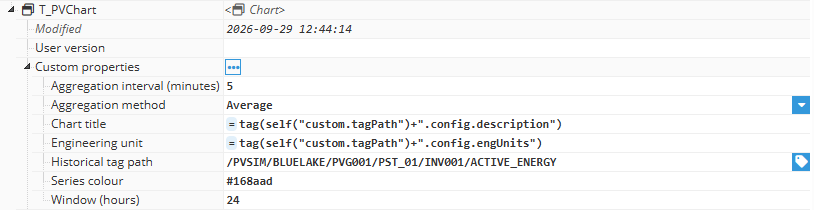
The chart title reads =self("custom.title"). Its series is a nested element, so its label uses parent() to access the template properties and appends the unit when one is available:
parent("custom.unit") ? parent("custom.title") + " [" + parent("custom.unit") + "]" : parent("custom.title")Historical data and series color
The template contains a HistoricalDataSet named DS_History. It reads the instance Tag path and time settings through parent(); the chart series references that DataSet:
parent("custom.tagPath")
parent("custom.windowHours")
parent("custom.aggregationMethod")
parent("custom.aggregationMinutes")
dataset("../DS_History")
Reusable project Functions
The project stores its shared Functions in the Functions folder. Web Vision calls a Function with =func("name", argument).
The colors Function
The colors Function maps a semantic name to a color. The chart card, axes, dashboard background, TagPicker, and labels call the same Function instead of repeating their base colors:
func("colors", "background")
func("colors", "panel")
func("colors", "text")
func("colors", "grid")
For example, the chart background uses func("colors", "panel"), and its axis lines use func("colors", "grid"). The Function in this export includes background, panel, border, text, muted, grid, accent, and accentSoft keys.
Design tip: Change a shared color in the colors Function to update all properties that reference its key. The four chart series keep separate seriesColor custom property values, so each trend remains distinguishable.
The sizes Function
The sizes Function centralizes a small type scale. In the example, the dashboard header calls =func("sizes", "font-title") and the auxiliary template labels call =func("sizes", "font-label"). The Function returns 28px and 22px for those keys, with 16px as the fallback.