Reports allow users to create reports as representations of data inside Web Vision.
It is composed of sub-elements called Report components.
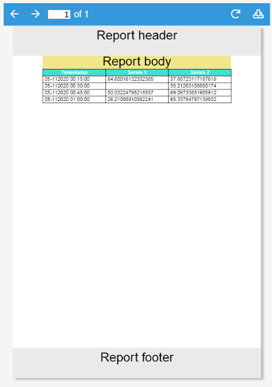
The main functionality of Report is to allow users to create PDF files with an easily printable layout.
Report size selection differs from other components, as it’s limited to a collection of standard paper sheet sizes. Whilst multiple pages are permitted in pdf mode, when in designer mode it is displayed as a continuous element with a viewport equal to the selected size.
The internal components in Report are ordered inside layouts, which are organized into rows and columns, similar to a Layout container.
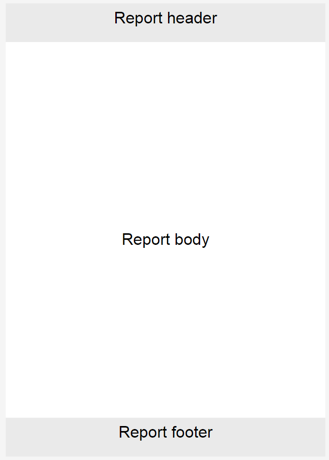
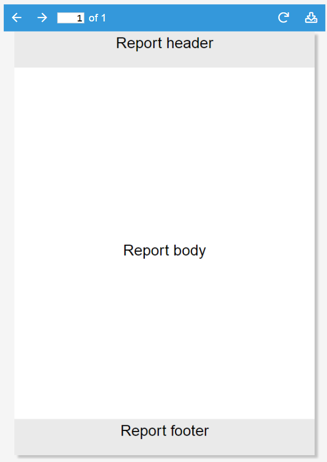
It contains three sections, a header and footer that are repeated at the end and start of each page (when in pdf mode) and the body, which will occupy as many pages as necessary in order to display all components included in the report.
In designer mode, all data displayed is mock data and is only used as a placeholder to allow users to design the report’s appearance and distribution. PDF mode displays real data.
It also offers two related actions for generating and downloading PDFs from outside the report element.
PDFs can only be generated in report instances. Report templates cannot be generated in this case.
PDFs are displayed in a pdf viewer, which allows page navigation, pdf generation and pdf download.
Report properties
Style properties
Property | Description |
|---|---|
Report background | Contains the properties used to configure the background colors of the report sections. |
Header color | Sets the background color of the report header. |
Body color | Sets the background color of the report body. |
Footer color | Sets the background color of the report footer. |
Format properties
Property | Description |
|---|---|
Page | Sets the report paper sheet size by selecting one of the supported paper formats from the dropdown list. |
Time zone | Sets the time zone used by report components that display timestamps. |
Fonts | Contains the properties used to embed custom font files for report styling and international character support. |
Margins | Contains the properties used to configure the margins of the report body, header, and footer. |
Font properties
Property | Description |
|---|---|
Normal | Sets the font file used to render regular text in the PDF. The default font is Helvetica. |
Bold | Sets the font file used to render bold text in the PDF. The default font is Helvetica-Bold. |
Italics | Sets the font file used to render italic text in the PDF. The default font is Helvetica-Oblique. |
Bold Italics | Sets the font file used to render bold italic text in the PDF. The default font is Helvetica-BoldOblique. |
Note:
Font properties are available from N3uron version 1.21.13.
Margin properties
Property | Description | |
|---|---|---|
Report | Sets the top, right, bottom, and left margins of the report body. The top and bottom margins also determine the available height of the header and footer. | |
Header | Sets the top, right, bottom, and left margins within the report header. | |
Footer | Sets the top, right, bottom, and left margins within the report footer. | |
Report properties
Property | Description | ||
|---|---|---|---|
Visualization | Contains the properties used to switch between report design and PDF viewing modes and configure the PDF viewer. | ||
Mode | Sets the report visualization mode to Designer or PDF. | ||
Designer | Displays the report design workspace. It behaves similarly to the Layout component but only allows report components as children. | ||
Displays a PDF viewer containing the report generated from the components configured in Designer mode. | |||
Generate on show | When enabled, generates the report when the component is first shown. For example, a report inside a container is generated when that container becomes visible. | ||
PDF header | Contains the properties used to configure the controls displayed in the PDF viewer header. | ||
Hide reload | Determines whether the button used to generate or reload the PDF is hidden. | ||
Hide download | Determines whether the PDF download button is hidden. | ||
PDF style | Contains the appearance properties of the PDF viewer. | ||
Header text color | Sets the text and icon color used in the PDF viewer header. | ||
Header background color | Sets the background color of the PDF viewer header. | ||
Header | Defines the instance list in which the report header elements are created. | ||
|
|
Report components
There are three instance lists within the Report, which behave similarly to the components instance list inside containers, although they do not accept the same elements. Instead, they support a specific set of elements known as report components.
Common properties
All report components share some properties.
Width
Defines element width. If null, the entire available width will be occupied. If the sum of all widths in the row is larger than the page width, the elements will overflow. Only width is available as a general property, as height is a free element, meaning that it can occupy as much height as necessary.
Format
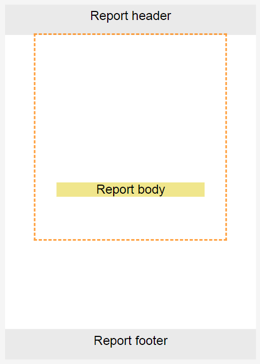
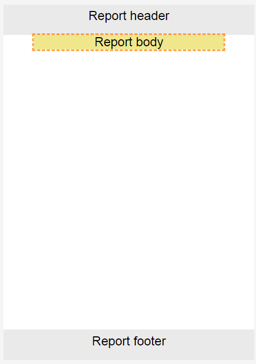
Much like the General Report, Format defines the element margins, allowing spaces to be set between the different elements to define the layout. Margins will be displayed graphically in designer mode using this selection.
|
|
Style
Default styles for all report components.
Property | Description | |
|---|---|---|
Background color | Defines the element's background color. Even when the margin appears inside the element selection, it’s not considered element space, so the background will not be extended to it. | |
Border | Border width | Width of the border line, in pixels. |
Border color | Border color. | |
Report layout
All report elements must be included as components in the report layout. The Report layout is very similar to that of a layout container. Although only the width can be controlled, the height will grow along with the component’s height. The report layout includes the following properties.
Property | Description | |
|---|---|---|
Page break | Defines when the page break should be relative to the element. Fit page break will only break the page if the element does not fit inside the page. | |
Direction | Defines whether elements are shown as elements of the same row or elements of the same column. | |
Report chart
Report chart graphically presents Datasets. The general procedure for configuring the chart is as follows:
Create Datasets and populate them with data in a format that the report chart supports. Series should be added to the report chart and associated to a dataset.
When no series has been added, mock series will be added as placeholders. These series will not show on the pdf.
Chart has the following configuration properties:
Property | Description | |
|---|---|---|
Height | Unlike layout, table, and label, chart has a defined height. | |
xAxis format | Datetime | X axis values are timestamps and labels are formatted timestamps. |
Categories | A category will be defined for every series, which will show the total cumulative value of the entire series. | |
xAxis/yAxis text alias | Text alias allows users to display labels instead of values. The first label corresponds to 0 and increments by one for every label in the list. There are 3 ways to define the label list:
| |
Series | Instance list where the series sub-elements will be instantiated. | |
Report chart series
Report chart series are Report chart sub-elements that define the properties of a series. Each series is shown as a succession of time points or as a category depending on the chart mode. It has the following properties.
Property | Description | |
|---|---|---|
Label | Series label. | |
Color | Series color. | |
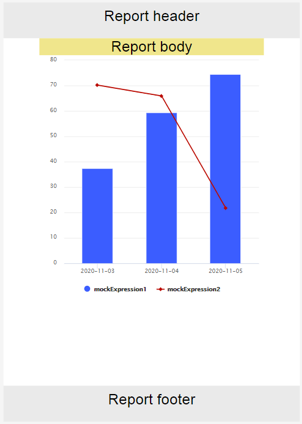
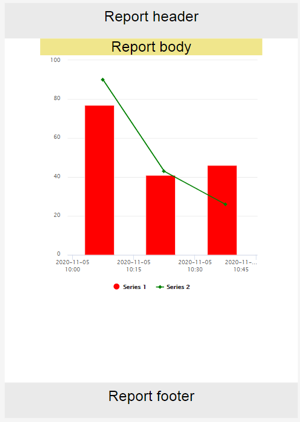
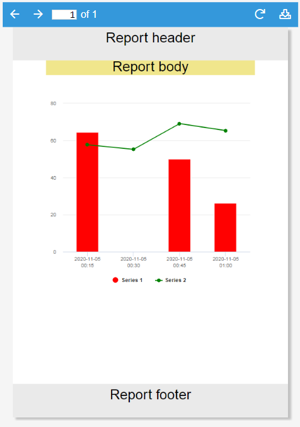
Chart type | Series type; can be Line, Area, Bar or Column, as seen in the following images: | |
Stacked | When enabled, values of this series will be stacked with other stacked series. | |
Dataset | Series data in dataset format. | |
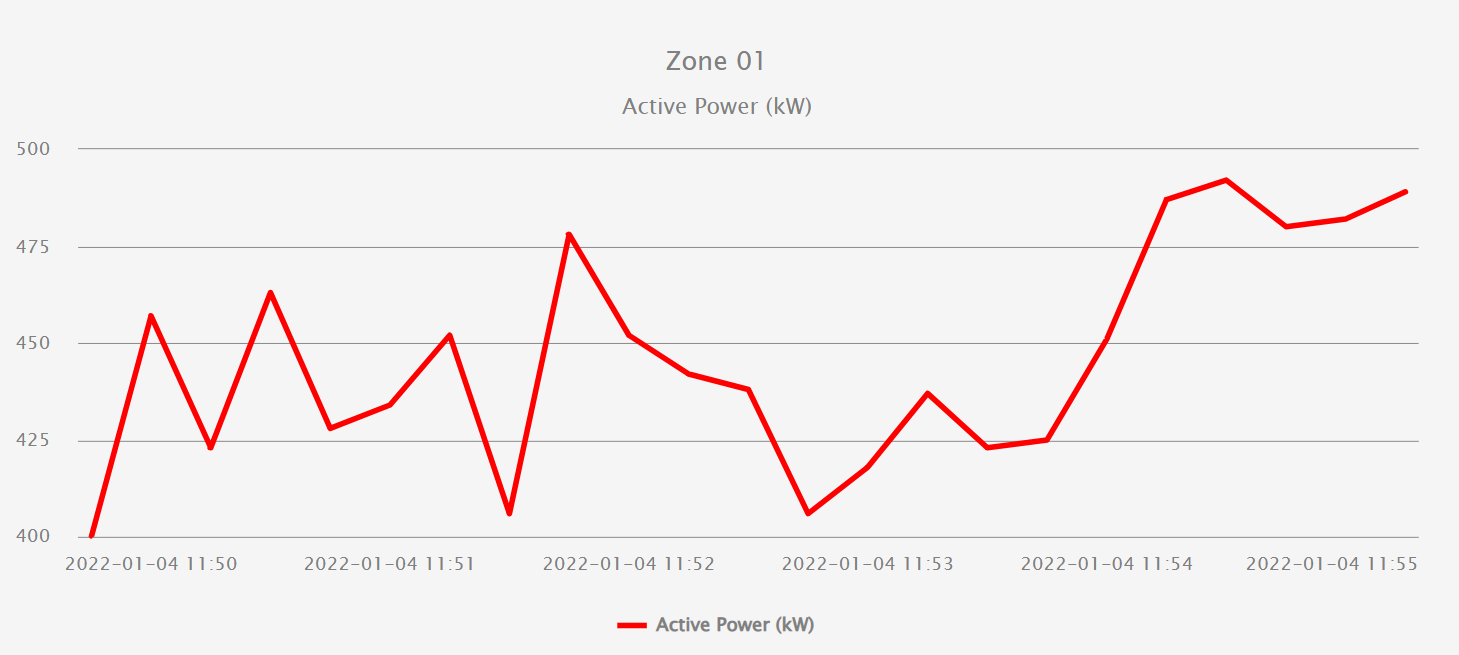
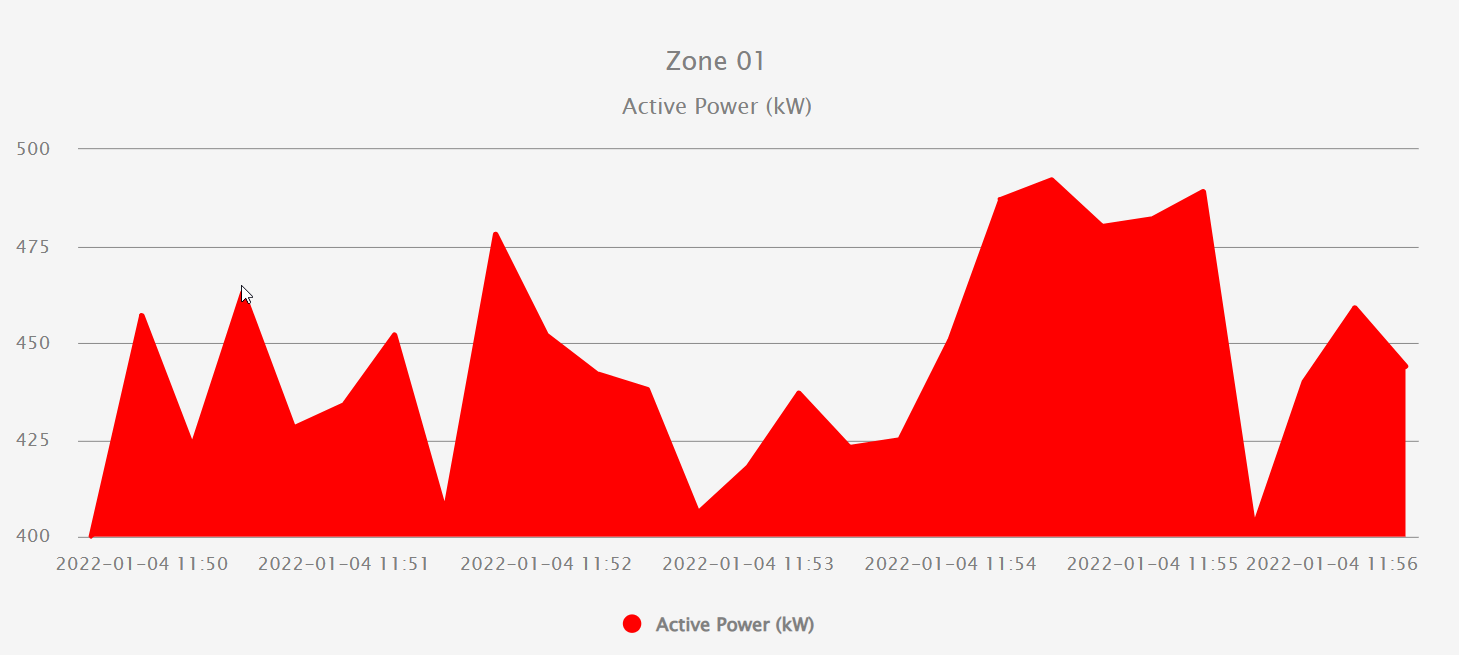
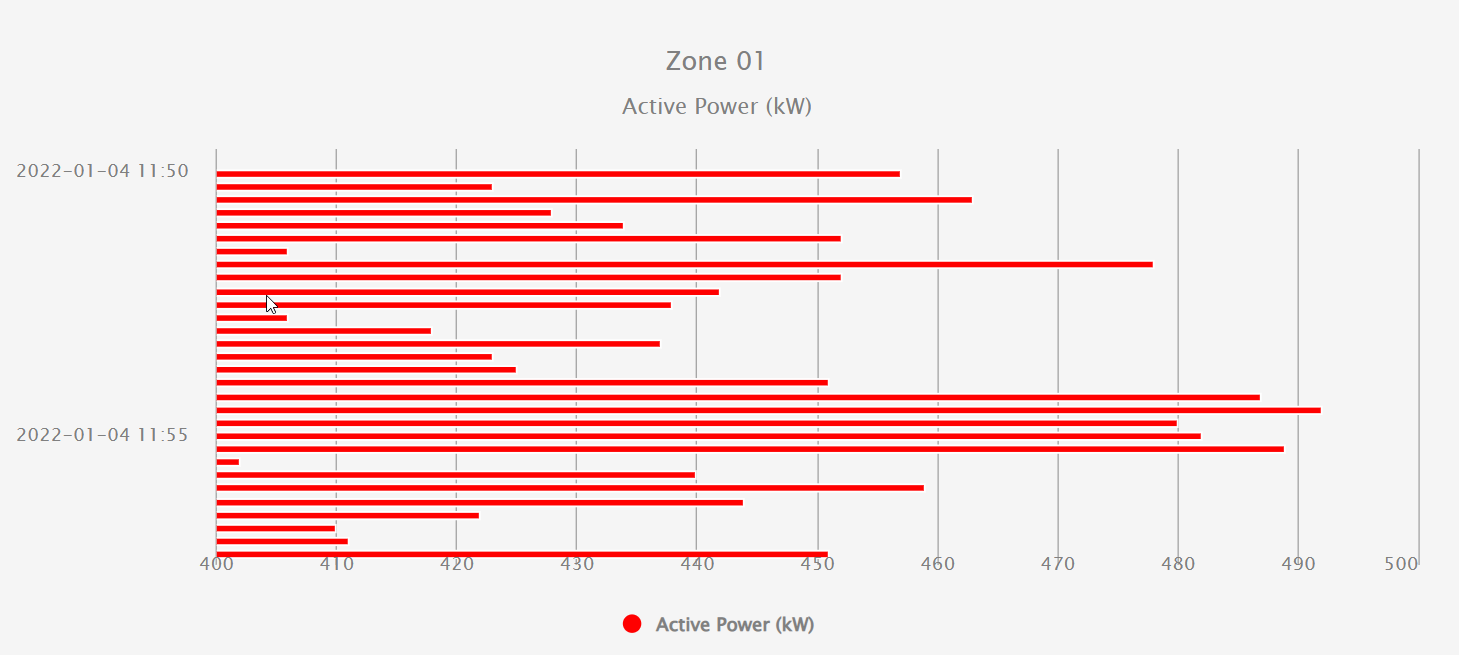
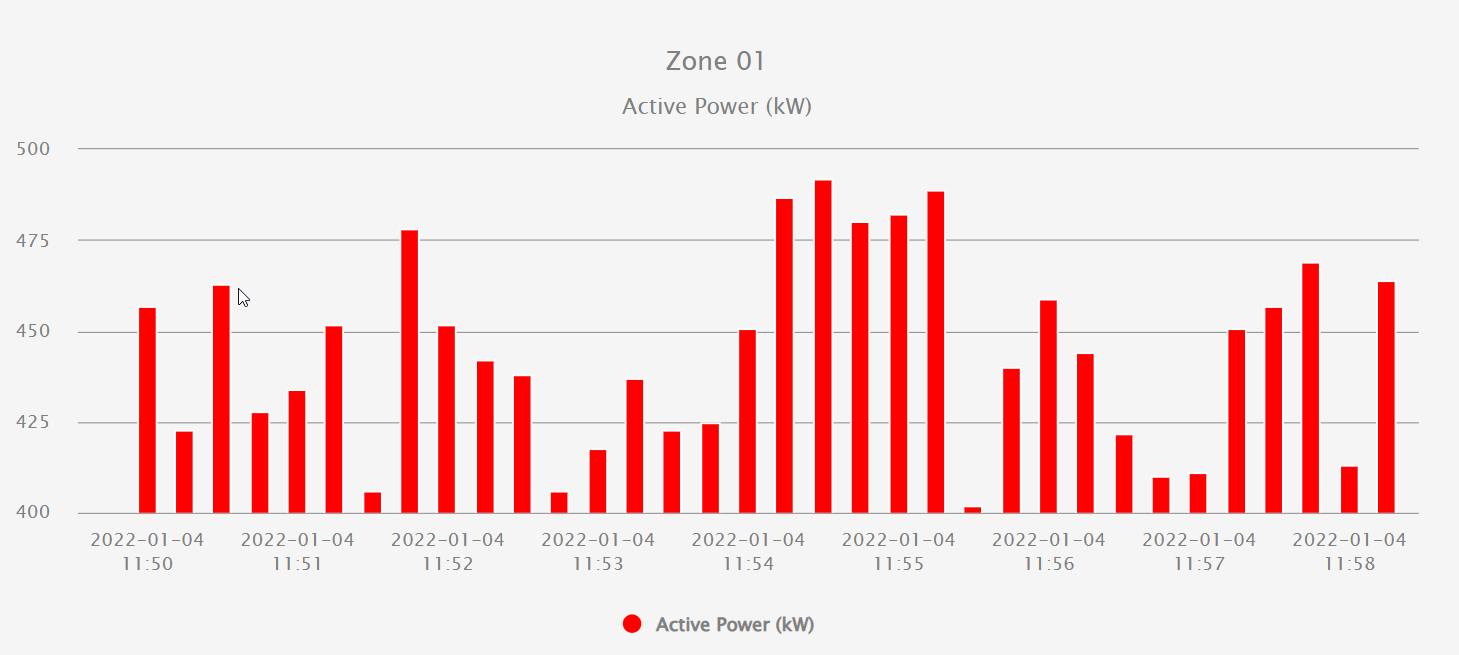
|
|
|
Report image
This report component inserts images onto the screen. Supported Image formats are .jpg, .png, .svg and gif. Unlike layout, table, and label, Report image has a defined height.
Report label
Report label allows labels to be added to the report. Labels are just static text that can be added like any other report component. As per the label component, different font styles can be set.
Report pie chart
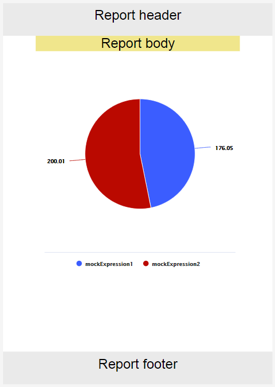
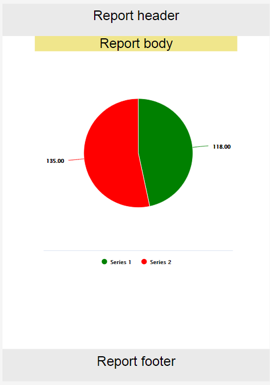
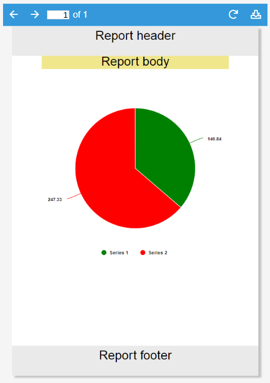
Report pie chart displays data as a circular chart divided into sections, each representing a different series, much like the Report chart series. The value of these sections is the sum of the total value of the Datasets configured in the corresponding series dataset field.
As per the Report chart, if no series have been added to the Report pie chart, mock series will be displayed as placeholders.
The Report pie chart includes the following properties:
Property | Description | |
|---|---|---|
Height | Report pie chart height. | |
Percentage | If true, displays data labels as percentages. If not, data labels are shown as absolute values. | |
Label decimals | Number of decimals shown in data labels. | |
Series | Instance list where the series sub-elements will be instantiated. | |
Report pie chart series
Report pie chart series are Report pie chart sub-elements that define the properties of a series. Each series is shown as a sector of the chart. It has the following properties:
Property | Description | |
|---|---|---|
Label | Series label. | |
Color | Series color. | |
Dataset | Series data in dataset format. | |
|
|
|
Report table
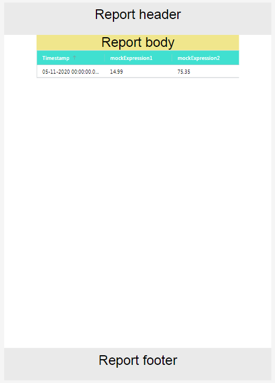
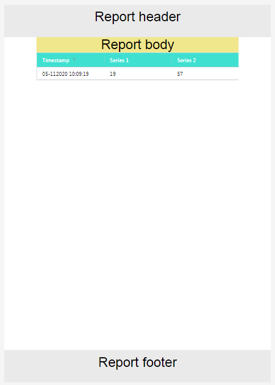
Report table allows the Datasets data to be displayed in a table format.
As per the Report chart and Report pie chart, Report table uses series to show data.
When no series exists, a placeholder will be shown. Placeholders will not be shown in pdfs.
Each series is either a column or row of the table, depending on its configuration.
In PDF mode, the table will occupy as much height as necessary.
Report table includes the following properties:
Property | Description | ||
|---|---|---|---|
Expressions as rows | When true, instead of showing as columns in the table, series will be displayed as rows, with the leftmost column set as the series name. | ||
Timestamp format | Timestamp format, as seen in the timestamp formatting appendix. | ||
Style | Font | Body text color | Color for text on body within the table. |
Header text color | Color for text on header row. | ||
Table background | Header color | Color for background of header row. | |
Series | Instance list where the series sub-elements will be instantiated. | ||
Report table series
Report table series are Report table sub-elements that define the properties of a series. Each series is displayed as a row or column of the table. It includes the following properties.
Property | Description | |
|---|---|---|
Label | Series label. | |
Value format | Value format based on the sprintf format specification. | |
Dataset | Series data in dataset format. | |
|
|
|
Web Vision Full Product Details