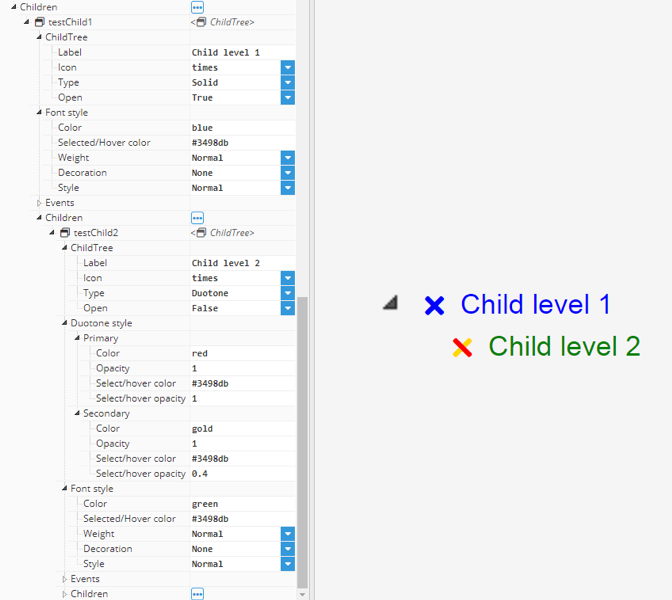
Each component has a unique set of properties that can be set and modified in the Designer. A component property is simply a named variable with a distinct type that affects something about the component's behavior or appearance, such as size, color, name or visibility.
Common properties for components
Size
Size fields define the dimensions of an element by specifying its width and height, in pixels.
Tooltip
Property | Description |
|---|---|
Enabled | Boolean value that enables the tooltip. |
Content | Text displayed inside the tooltip. |
Show position | Relative positioning in relation to the element. Options include Top, Right, Bottom, and Left. |
Show on | Specifies the trigger event for displaying the tooltip, either by hovering over the element or clicking on it. |
Show delay | Time in milliseconds before the tooltip appears after triggering (set to 0 for immediate display). |
Hide delay | Time in milliseconds before the tooltip disappears after triggering (set to 0 to prevent automatic hiding. |
Style
Property | Description | |
|---|---|---|
Background | The color that fills the background area of an element. | |
Border | Element border. Border is not affected by padding. | |
Border width | Thickness of the borders in pixels. | |
Border color | Color of the border lines. | |
Border radius | Curvature of the container’s corners. | |
Padding | Specifies the space between the edge of the component and its internal content. | |
Scroll | Scroll bar that appears when an element contained exceeds the visible area of the container. | |
Scroll color | Defines the color of the scroll bar. | |
Scroll width | Defines the width of the scroll bar in pixels. | |
Font style
Components with configurable text have a group of common style properties related to the font.
Property | Description |
|---|---|
Color | Font color. |
Size | Font size, in pixels. |
Weight | Font weight; normal or bold. |
Decoration | Font decoration; add lines to text in multiple positions. |
Style | Activates the italics font. |
Align | Allows text to be aligned inside the element’s visual area. |
Table styles
Table elements, such as AlarmTable and RealtimeTable, include a set of common styles related to the header, body, and borders. Cell/Row colors can also be configured to act as filters based on regular expressions. This allows certain rows/cells to be colored inside the table. Whilst there are some differences between these two tables, they’re similar enough to be included in this chapter.
Property | Description | ||
|---|---|---|---|
Table header | Resizer color | Color of the resizer anchor for column resizing. | |
Font Style | Styling for the text on headers. See Font Style for further information. | ||
Background color | Color of the background of header cells. | ||
Table body | Message color | Color of the messages displayed if table is empty or any error occurs. This field supports any valid CSS color. | |
Font Style | Styling for the text on headers. See Font Style for further information. | ||
Background | Color | Defines the primary color for the table body area. | |
Selected row color | Defines the color applied to a row when an the users selects it. | ||
Hover row color | Defines the color of a row when the mouse cursor is positioned over it. | ||
Even row color | Defines the background color of even-numbered rows. | ||
Odd row color | Defines the background color of odd-numbered rows. | ||
Table border | Header color | Defines the color of the borders surrounding the table header. | |
Header width | Specifies the thickness of the header borders in pixels. | ||
Body color | Defines the color of the borders for the rows within the table body. | ||
Body width | Specifies the thickness for the rows within the table body in pixels. | ||
Cells colors | Styling to be applied on cells in which the filter specified is accomplished. | ||
Column | Selects the specific column to which the formatting will be applied. | ||
Filter | Value or Regular Expression used to evaluate the data in the selected column. If the data matches the filter, the style will be applied. | ||
Text color | Specifies the color applied to the text of the cell affected. | ||
Background color | Specifies the color applied to the background of the cell affected. | ||
Rows colors | Styling to be applied on rows in which the filter specified is accomplished. | ||
Column | Selects the specific column to which the formatting will be applied. | ||
Filter | Value or Regular Expression used to evaluate the data in the selected column. If the data matches the filter, the style will be applied. | ||
Text color | Specifies the color applied to the text of the row affected. | ||
Background color | Specifies the color applied to the background of the row affected. | ||
Events
All components can have events attached to them. Events are triggered under certain user interactions, and one or more actions are executed whenever the event is triggered. The action can be used to write a value to a tag or to change a property from this or another component, such as the color or the visible property.
A more detailed description of events can be found in Triggers and Actions sections.
Alarm counter
Alarm counters display the number of alarms matching the configuration of the filters.
Property | Description | ||
|---|---|---|---|
Data options | Path | Filters alarms by tag path. Only tags included in this tag path are included. | |
Sublevels | When set to true, filters include all sublevels of the path. | ||
Path Filter | Regular expression (regex) applied to the tag path. Only tags matching the regular expression are included. | ||
Status | Filters the alarm status using a comma-separated list of the following codes. | ||
Cleared and acked | 0 | ||
Active and acked | 1 | ||
Cleared and unacked | 2 | ||
Active and unacked | 3 | ||
Minimum priority | Filter for excluding low priority alarms. | ||
Maximum priority | Filter for excluding high priority alarms. | ||
Alarms | Format type | Specifies de numeric formatting patter used to transform a scalar number into a standardized string | |
Format | Defines the numeric formatting using a standard sprintf expression. | ||
Note:
Starting from N3uron version 1.21.7, flexible column ordering has been implemented for Alarm Table.
Alarm table
Alarm Tables can be configured to list the current status of alarms (Realtime) or the evolution of alarms through their different statuses within a specific period (Historical Alarms).
Note:
Alarms must be set up on a Tag for it to show up in the Alarm Table. Alarm Historization must also be enabled in the same node as Web Vision in order to access historical alarms.
Property | Description | ||
|---|---|---|---|
Data options | Path | Filters alarms by tag path. Only tags included in this tag path will be included. | |
Sublevels | When set to true, filter will include all sublevels of this path. | ||
Path Filter | Regular expression (regex) applied to the tag path. Only tags matching the regular expression will be included. | ||
Status | Filters alarm status using a comma-separated list of the following codes: | ||
Cleared and acked | 0 | ||
Active and acked | 1 | ||
Cleared and unacked | 2 | ||
Active and unacked | 3 | ||
Minimum priority | Filter for excluding low priority alarms. | ||
Maximum priority | Filter for excluding high priority alarms. | ||
Type | Realtime displays the current status of alarms, while Historical demonstrates the evolution of alarms throughout each status within a specific period of time (defined in Start and End). | ||
Start | Retrieval start date for historical alarms. | ||
End | Retrieval end date for historical alarms. | ||
Multiselection | Enables more than one alarm to be selected in the table. | ||
Selected | This property contains the tag path for all of the selected alarms. | ||
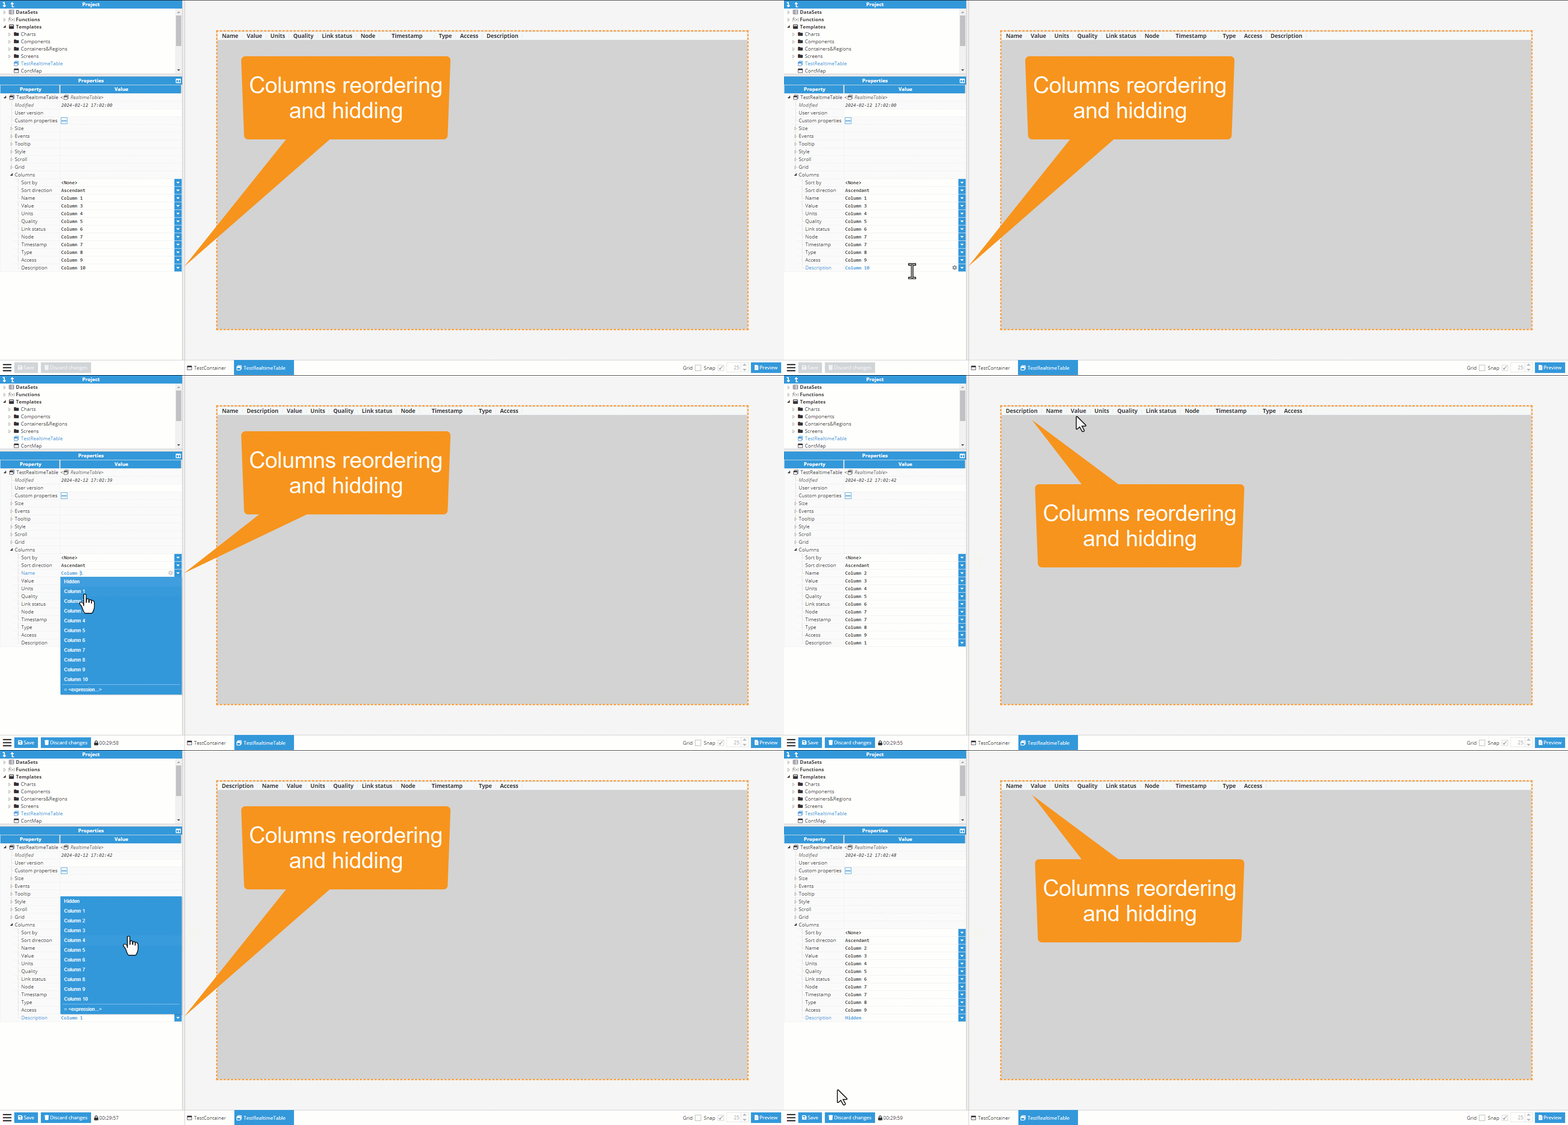
Columns | Allows table columns to be hidden/shown and reordered. | ||
Alarms | Multiselection | Enables the selection of multiple alarm rows simultaneously. | |
Sort by | Specifies the primary column to be used to organize the alarms list. | ||
Sort direction | Specifies the sorting order of the selected column. | ||
Shelved alarms | Enabled | Enables the visibility of shelved events in alarms data | |
Dataset Table
The Dataset Table component displays user-defined datasets in a customizable table format. It is intended for building dynamic views where rows, columns, headers, sorting, selection, and visual styling are driven by the dataset configuration.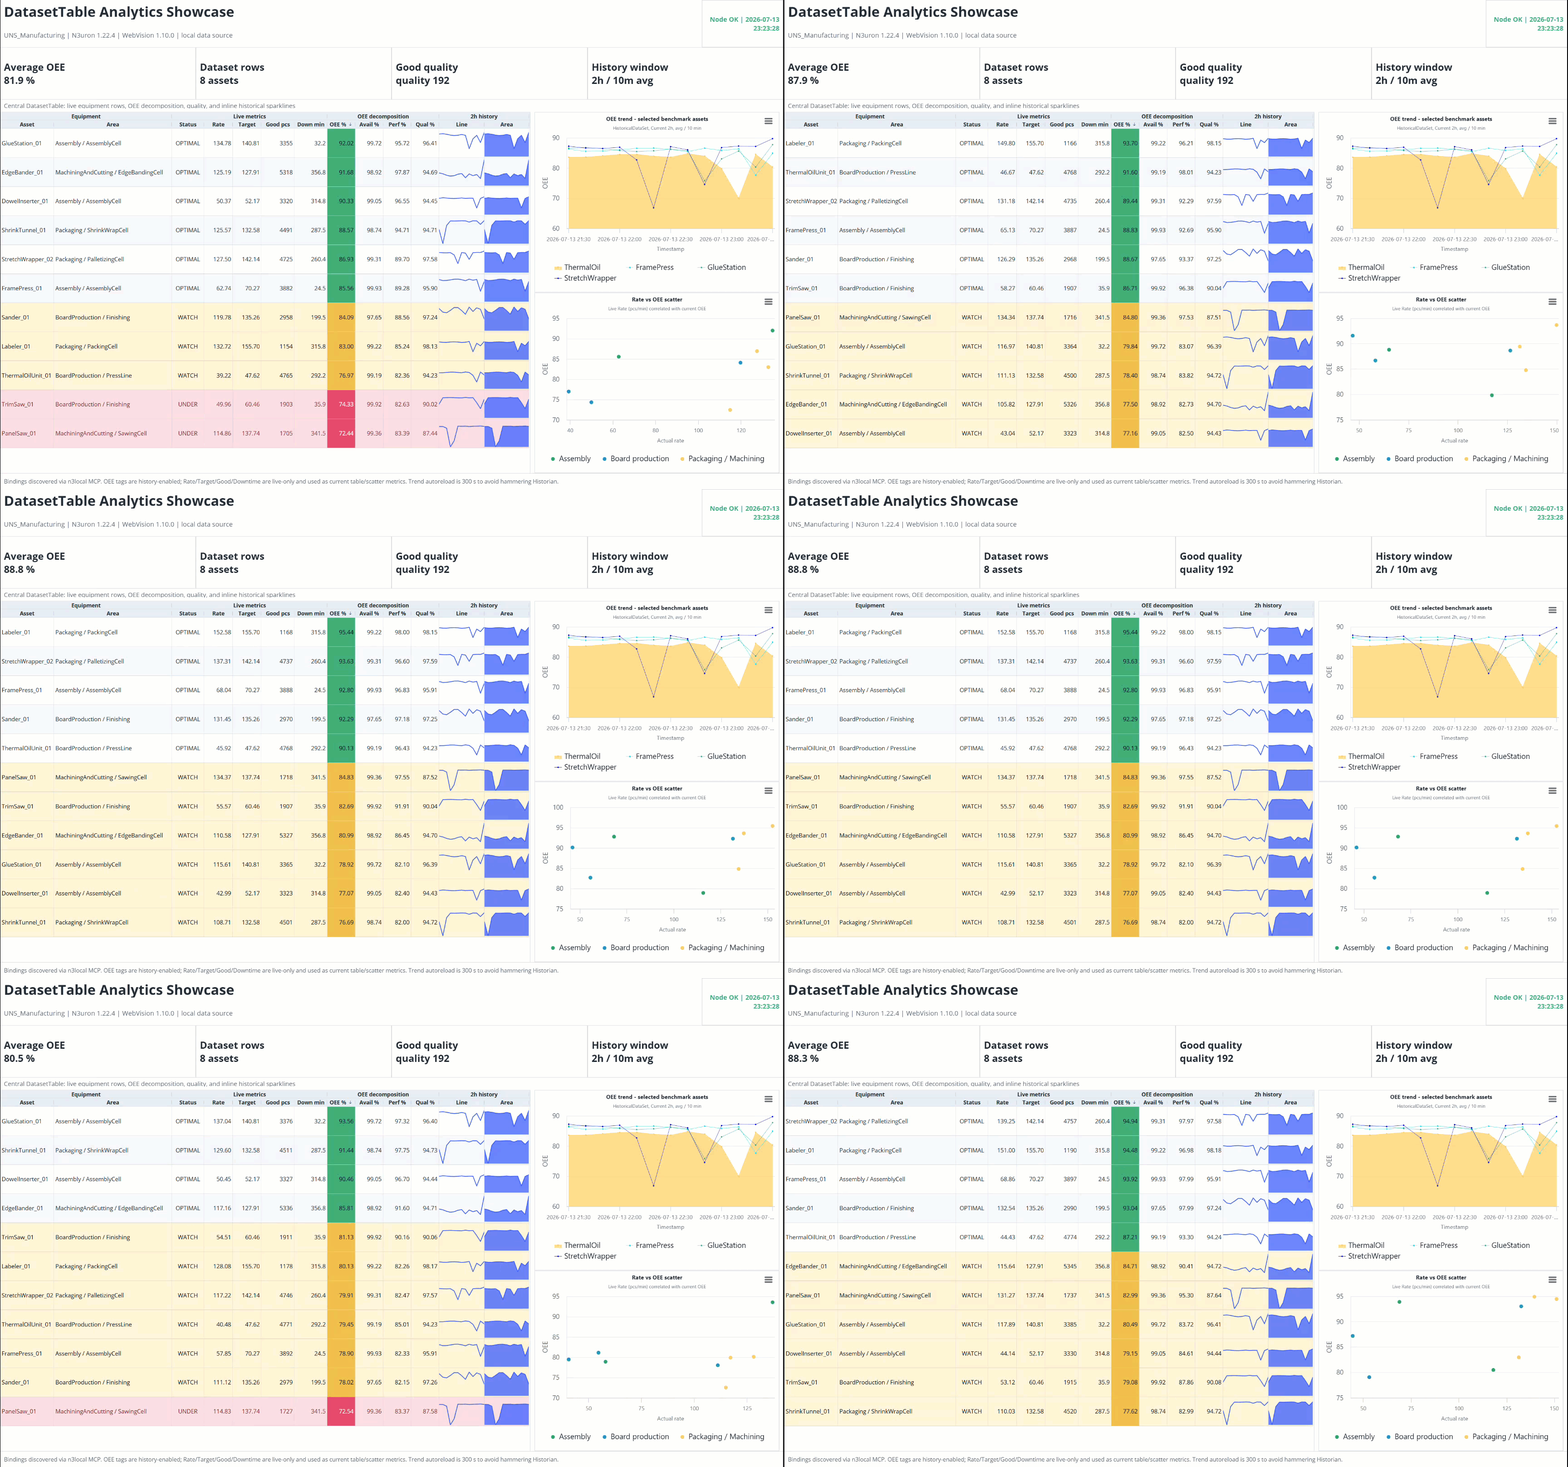
Property | Description | ||
|---|---|---|---|
Style | Table header | Resizer Color | Specifies de color of the vertical bar used to resize columns withing table header. |
Table body | Message Color | Sets the color for system messages, displayed when a cell is empty or an error occurs during data retrieval. | |
Table border | Header color | Defines the color of the borders surrounding the table header cells. | |
Header width | Defines the thickness of the borders surrounding the table header. | ||
Body color | Defines the color of the borders surrounding the table body cells. | ||
Body width | Defines the thickness of the borders surrounding the table body cells. | ||
Row & Cell color | Allows users to apply styles to specific rows or cells, based on the filters configured for each style. | ||
Column | Selects the column for which the value filter is applied. | ||
Filter | Sets the value to filter for the style to be applied. | ||
Text Color | Sets the color to be applied on the text for the row or cell when the filter matches the value on the column. | ||
Background Color | Sets the color to be applied on the background for the row or cell when the filter matches the value on the column. | ||
Table | Data | Expression that evaluates to the array of rows used as the table's data source. Row values can be scalar primitives, live real-time tag objects (timestamp, value, quality), or nested historical time-series arrays ([[timestamp, value], ...]).
| |
Row key | Field name or index used as the unique identifier for each row. Required when inline editing is active or when using embedded sparkline columns. Leaving it blank forces unstable fallback position-based mapping. | ||
Header | Shows or hides the table header. | ||
Drag-orderable columns | Enables users to reorder columns by dragging them. | ||
Empty message | Text displayed when there is no dataset data to show. | ||
Row height | Defines the height of each table row. | ||
Selected row | Stores or defines the currently selected row. | ||
Row count | Displays the number of rows currently available in the table. | ||
Selection | Enabled | Enables row selection in the table. | |
Multiple | Allows multiple rows to be selected simultaneously. | ||
Sort | Sort by | Defines the column or dataset field used to sort the table. | |
Sort direction | Defines the sorting direction. | ||
Header Groups | Defines grouped headers that visually organize related columns under a shared top-level heading (for example, grouping several columns under OEE decomposition or Live metrics). Each header group has: | ||
Title | Defines the text presented for multi-columns grouped header. | ||
Text color | Sets the font color applied to the header group title. | ||
Background color | Sets the background color applied to the header group title. | ||
Parent group | Refers to header group fora multi-tier nested header architecture, or sets as primary group if left blank. | ||
Columns
Property | Description |
|---|---|
Title | Descriptive text displayed in the column header. |
Field | Attribute name or numeric array index that maps a source dataset field to the column. |
Header group | References a configured header group to organize the column within a multi-level header. A null value leaves the column outside any header group. |
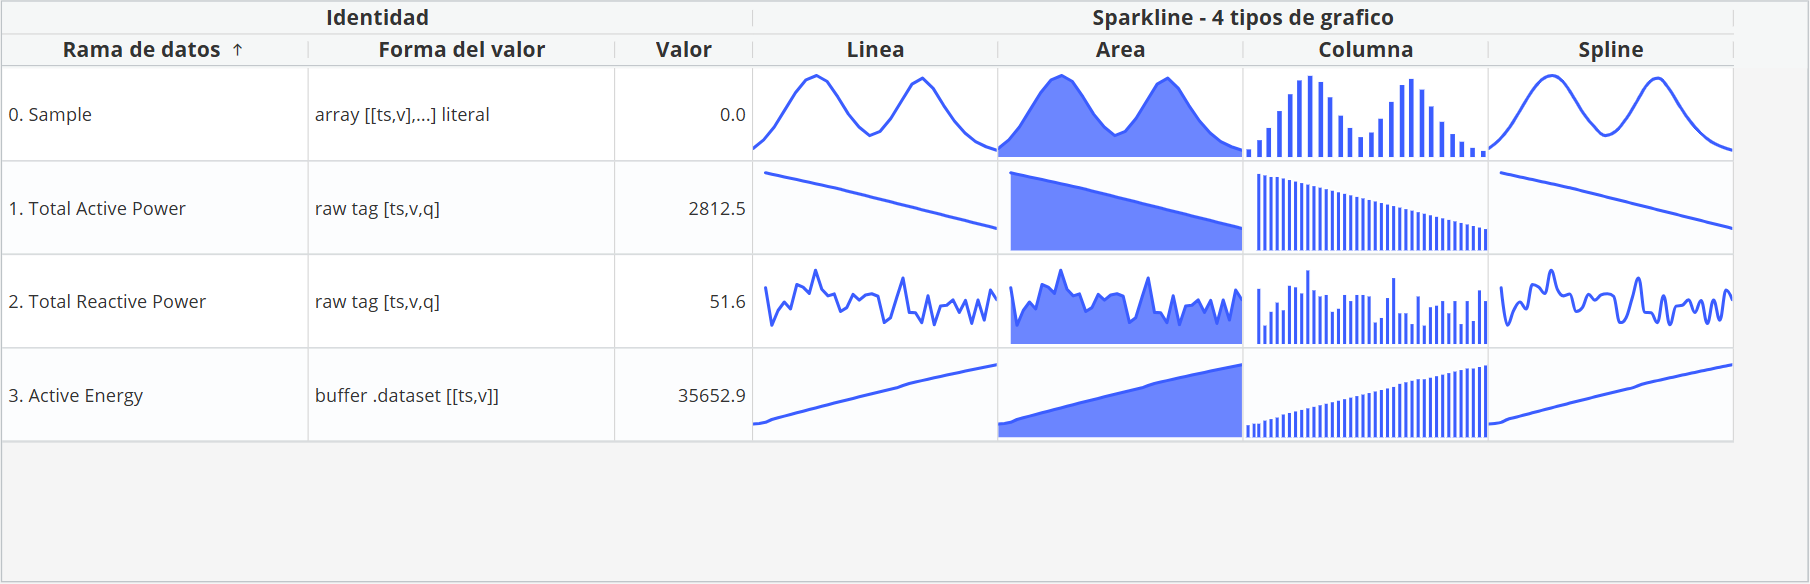
Renderer | Defines how cell values are rendered. Select text to display scalar values as strings or sparkline to display inline time-series charts. |
Editable | Determines whether users can edit cell values directly in the table. |
Sortable | Enables or disables sorting for the column. |
Resizable | Determines whether users can resize the column interactively. |
Width mode | Defines how the column width is calculated, such as using a fixed value or adjusting it automatically to the available space. |
Width | Specifies the column width when a fixed width mode is used. |
Visible | Determines whether the column is displayed in the table. |
Datasets | The Dataset Table can instantiate datasets, including Derived and Historical datasets, that feed the table's cells and inline sparkline columns. Each dataset is configured exactly as elsewhere in Web Vision. |
Columns | Description | |
|---|---|---|
Style | Vertical align | Defines whether the column content is aligned to the top, center, or bottom of the cell. |
Horizontal align | Defines whether the column content is aligned to the left, center, or right of the cell. | |
Columns | Description | ||
|---|---|---|---|
Format | Format type | Selects the formatting mechanism applied to the column value. | |
Format options | sprint | Defines the formatting string. For sprintf, standard format specifiers such as %s, %d, or %.2f can be used. | |
Locale | Defines the locale used to format the value using an IETF BCP 47 language tag. The locale affects elements such as decimal and grouping separators. | ||
Style | Determines how numeric values are formatted: decimal for general numbers, currency for monetary values, or percent for percentages. | ||
Currency | Sets the three-character ISO 4217 currency code when Style is set to currency. | ||
Currency display | Controls whether the currency is represented by its symbol, code, or name. | ||
Group separator | Determines whether grouping separators are displayed when supported by the selected locale and formatting options. | ||
Min. integer digits | Sets the minimum number of integer digits displayed. Leading zeros are added when necessary. | ||
Min. fraction digits | Sets the minimum number of decimal places displayed, from 0 to 20. If null, the default is 0 or the minor unit defined for the selected currency. | ||
Max. fraction digits | Sets the maximum number of decimal places displayed, from 0 to 20. If null, the formatter determines the default from the selected style and minimum fraction digits. | ||
Prefix | Custom string added before the formatted value. | ||
Suffix | Custom string added after the formatted value. | ||
For a complete example, see the step-by-step guide: Building a Dataset Table.
Button
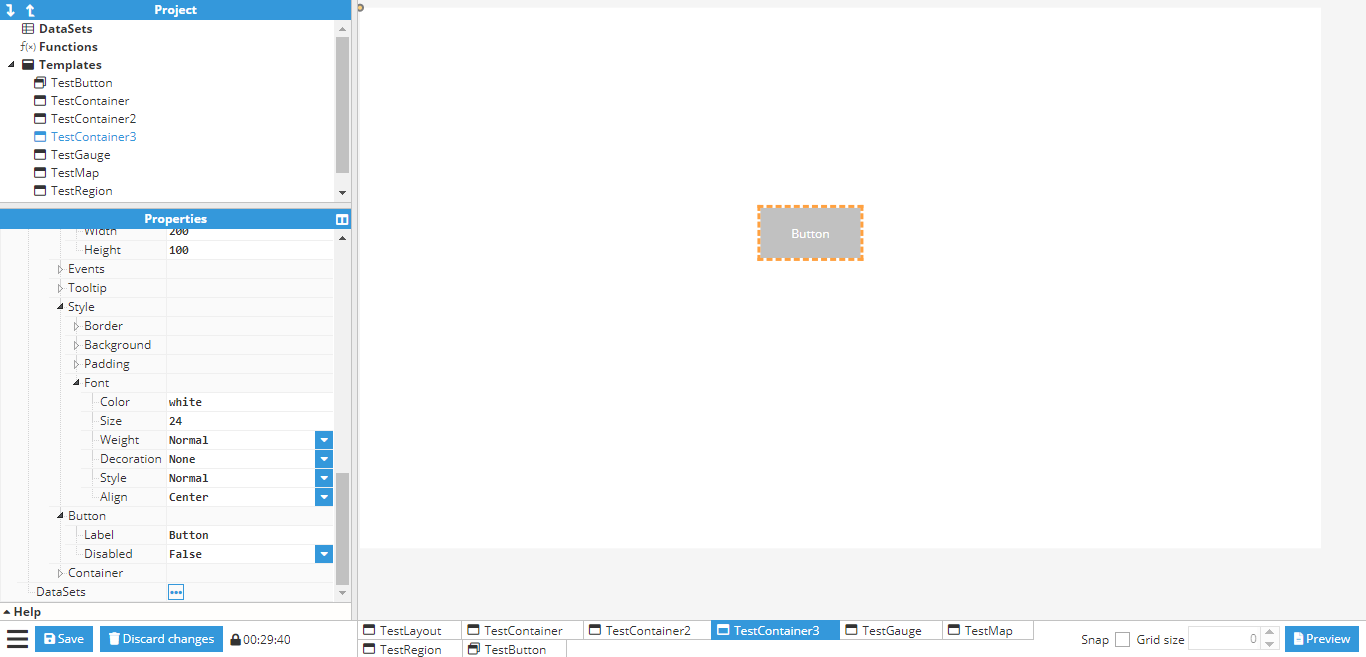
Buttons are visual elements the user can quickly identify as interactive elements to be used for an event to be triggered, enabling users to associate certain actions with button clicks. All actions properties can be set up statically or dynamically (linked to another property or calculated through embedded code). It’s also possible to enable/disable the entire component, cancelling interactions with it if not enabled. In addition to actions properties, which determine the main functionality of the button, the following configuration options are also available:
Property | Description | |
|---|---|---|
Background styles | Main color | Button color when not hovered over. |
Hover color | Button color when hovered over. | |
Disabled color | Button color when disabled. | |
Button | Label | Displayed text on button’s visual element. |
Disabled | Enables/disables button functionality (changes button color and blocks the hover color and events disable function). | |
Iframe
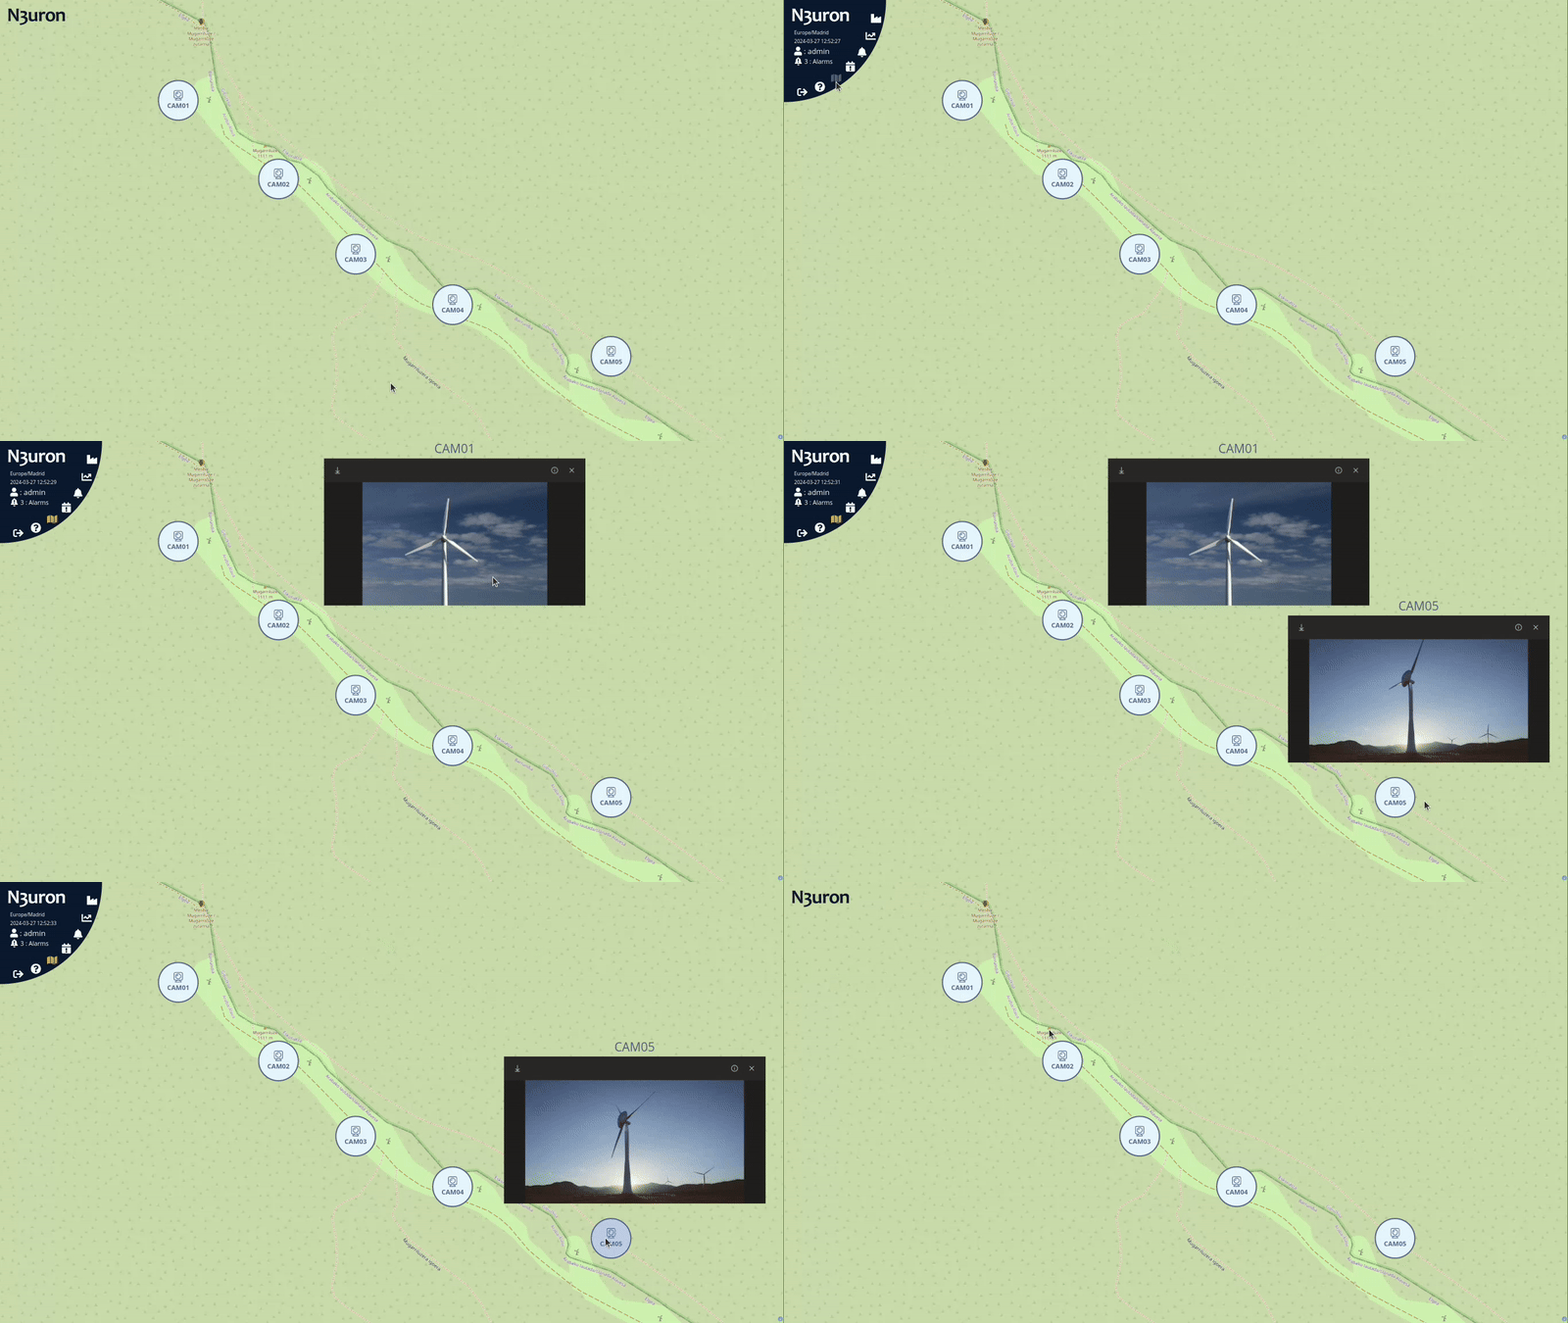
Incorporating Iframes into your Web Vision can greatly enhance its functionality. By embedding real-time data visualization tools, video streamings or external applications directly within the Web Vision interface using iframes, operators can seamlessly monitor and control various processes without the need to switch between multiple software platforms.
Iframes offer the following particular configuration property, apart from the basic properties shared with other components:
Property | Description |
|---|---|
URL | URL to load in the iframe. |
In the following example, an iframe is created with dimensions matching the parent container, and the URL points to https://www.example.com.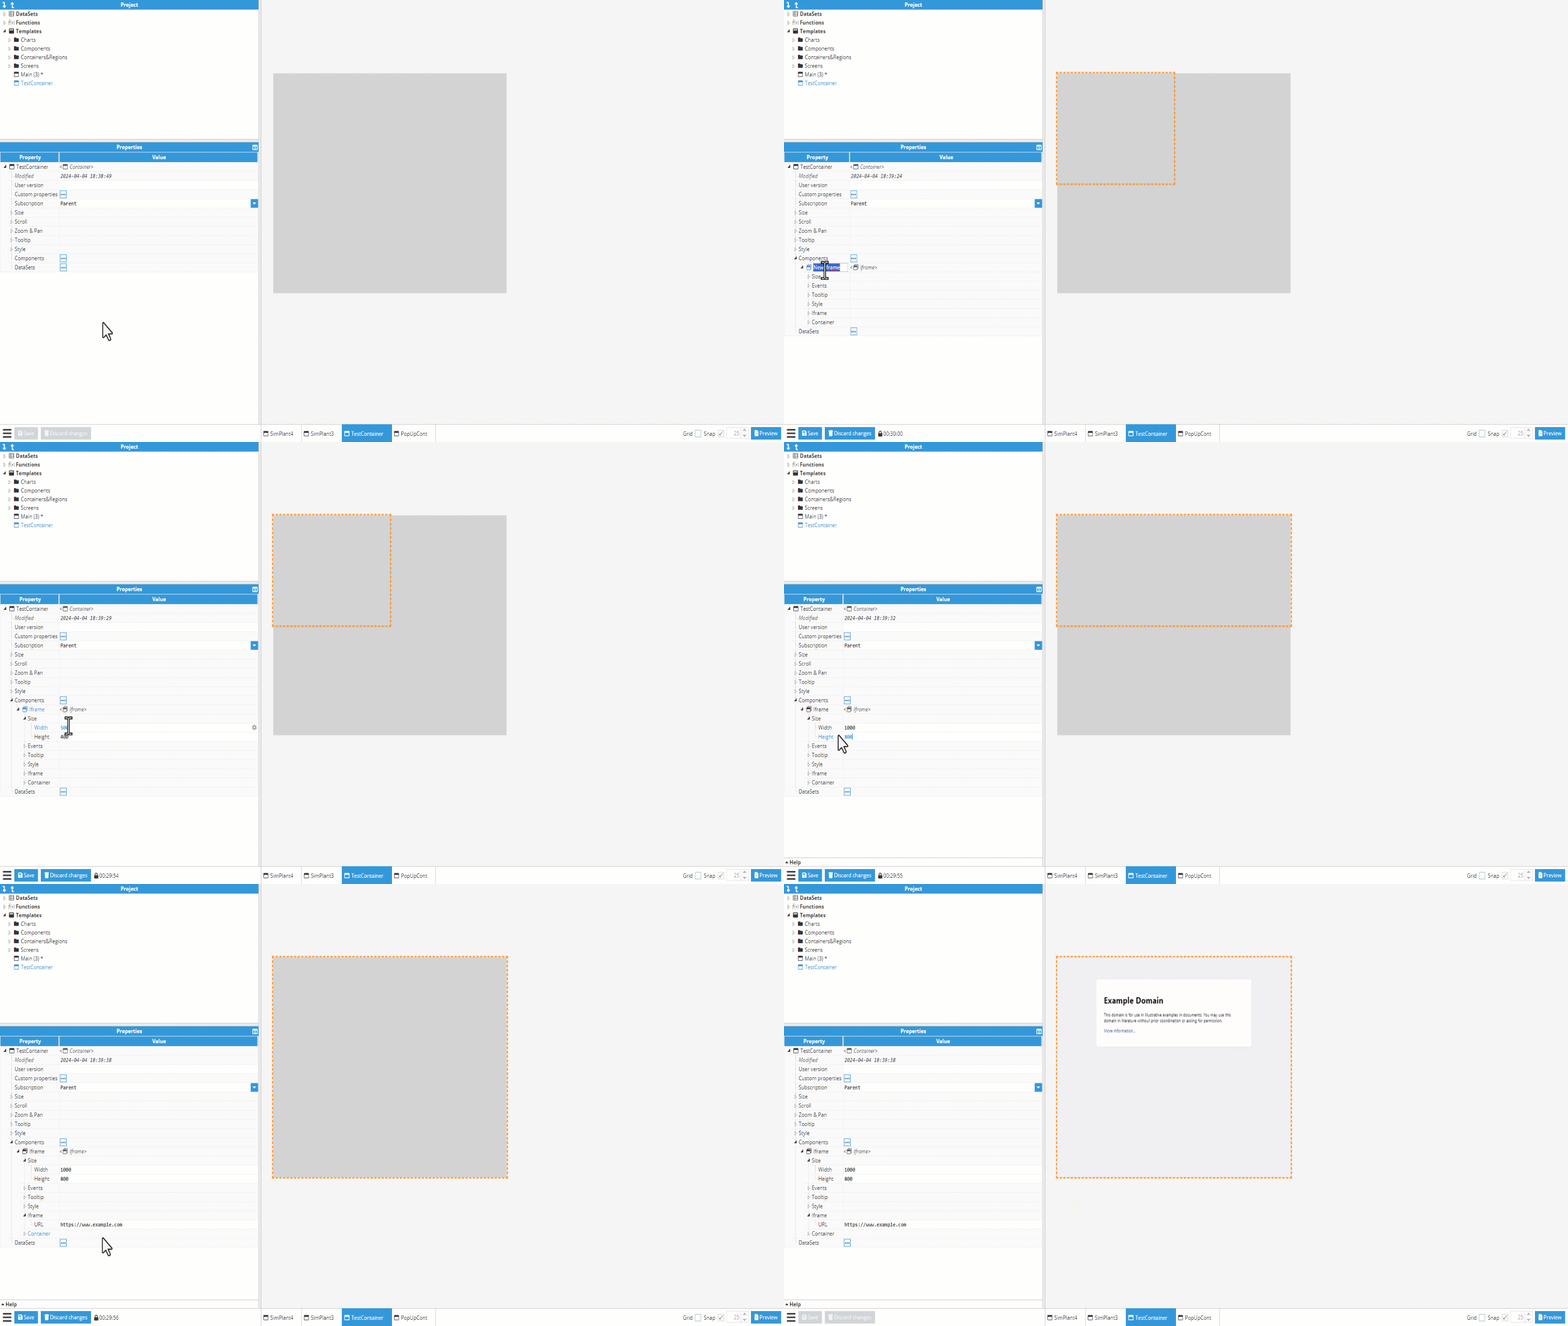
Note:
This feature is available from N3uron version 1.21.8.
Chart
Chart components graphically present Datasets. The general procedure for configuring charts is to create each required Dataset, populate them with data in a format that the chart can support and associate each of them with their Serie’s chart child. Series can then be added to the chart.
Property | Description | |
|---|---|---|
Zoom | Enabled | When enabled, Zoom functionality will be enabled for the chart |
Note:
This feature is available from N3uron version 1.22.0.

Chart
X Axis | Description | |
|---|---|---|
Text alias | Text alias allows users to display labels instead of values. The first label corresponds to 0 and increments by one for each label in the list. There are 3 ways to define the label list:
| |
Title | X axis title. | |
Minimum | Sets the minimum value of the X axis, hiding smaller values.
| |
Maximum | Sets the maximum value of the X axis, hiding larger values.
| |
Type | Datetime | X axis values are timestamps and labels are formatted timestamps. |
Categories | A category will be defined for each series, which will include the total cumulative value of the entire series. | |
X Axis | Description | ||
|---|---|---|---|
Shared Y axis | Y axis configuration options. As the name suggests, properties are shared between all the series sharing the base Y axis. A series can have its own Y axis, which when set in this way, will share these same properties for configuring the Y axis. | ||
Text alias | Text alias allows users to display labels instead of values. The first label corresponds to 0 and increments by one for each label in the list. There are 3 ways to define the label list:
| ||
Values | Minimum | Sets the Y axis minimum value, hiding smaller values. <null> or empty for an automatic limit. | |
Maximum | Sets the Y axis maximum value, hiding bigger values. <null> or empty for an automatic limit. | ||
Padding | Minimum | Add extra spacing at the start of the axis. Value is expressed as a percentage (a value of 0.05 corresponds to 5%). If Tick Force start is set to True, the actual start will be moved to fit the tick count. | |
Maximum | Add extra spacing at the end of the axis. Value is expressed as a percentage (a value of 0.05 corresponds to 5%). If Tick Force end is set to True, the actual end will be moved to fit the tick count. | ||
Ticks | Count | Number of ticks on this axis. Ignored if Text alias has been set. If set to a specific number, align lines will not work as expected unless all axes are set to the same tick count. If the value is left empty, ticks will be selected automatically, otherwise, the number of ticks will be displayed. The minimum permitted is 2 ticks, which corresponds to both minimum and maximum. | |
Force start | When set to True, a tick will be forced at the start of the axis. | ||
Force end | When set to True, a tick will be forced at the end of the axis. | ||
Style | Chart lines width | Width of the grid lines associated to this axis. | |
Chart lines color | Color of the grid lines associated to this axis. | ||
Axis line width | Width of vertical grid lines. | ||
Axis line color | Color of vertical grid lines. | ||
Text color | Color of axis title and labels. | ||
Style
Style | Description | |
|---|---|---|
Legend | Show | Show/hide legend. |
Legend font size | Font size in pixels for legend labels. | |
Label color | Label text color. | |
Disabled color | Label text color when series are disabled. | |
Title | Font size | Title font size in pixels. |
Color | Title font color. | |
Subtitle | Font size | Subtitle font size in pixels. |
Color | Subtitle font color. | |
Style | Description | |
|---|---|---|
Series | Tooltip enabled | Enables/disables the tooltip when hovering over a series. |
Tooltip font size | Font size in pixels for series border.. | |
Marker radius | Dot radius on data points when a series is a line or area type. | |
Line width | Width of line when series is a line or area type. | |
Border color | Border color for series that are a column or bar type. | |
Border width | Border width for series that are a column or bar type. | |
Style | Description | |
|---|---|---|
X axis | Chart lines width | Vertical chart line (coincident with data points) width. |
Chart lines color | Vertical chart line (coincident with data points) color. | |
Line color | Separator line between x axis labels and series area color. | |
Line width | Separator line between x axis labels and series area width. | |
Tick spacing | Horizontal axis spacing between label ticks. Only applies to datetime types without a label alias | |
Force tick start | When True, a tick is forced at the start of the X axis. | |
Force tick end | When True, a tick is forced at the end of the X axis. | |
Title font size | Text size in pixels of X axis title. | |
Labels font size | Text size in pixels of X axis labels. | |
Text color | Text color of X axis title and labels. | |
Style | Description | |
|---|---|---|
Y axis | Align lines | When True, automatically aligns horizontal grid lines from different series. Must be properly coordinated with Y axis Tick count configuration. |
Axis spacing | Spacing between multiple axes. | |
Title font size | Text size in pixels of all Y axis titles. | |
Labels font size | Y axis label text size in pixels. | |
Series
The Chart component defines data based on a series; each series is defined as a sub-element of a chart inside an instance list labeled as “Series”. Each series has multiple configuration properties, which define its behavior and appearance.
Property | Description | ||
|---|---|---|---|
Label | Series label. | ||
Color | Series color. | ||
Type | Series type; can be Line, Area, Bar or Column. | ||
Interpolation | Draw series with a stepped line. | ||
Dataset | Series data in dataset format. | ||
Y axis | Shared | Series shares Y axis with other series. | |
Own | Series uses its own Y axis. | ||
yAxis | Y axis options based on Y axis type. | ||
Shared | Stacked | When enabled, values of this series will be stacked with other stacked series. | |
URL | Includes the same properties as the Shared Y Axis properties group. | ||
ScatterChart
The ScatterChart component displays data points on a two-dimensional chart using X and Y values. It is used in Web Vision to visualize relationships, distributions, correlations, or trends between two numeric variables.
While charts are used to represent the progression of values over time, scatter charts represent points of data pairs using two numeric values: one for the X axis and one for the Y axis. It is useful when the main goal is to analyze the relationship between two variables. For example, comparing OEE with the actual production rate in pieces per minute.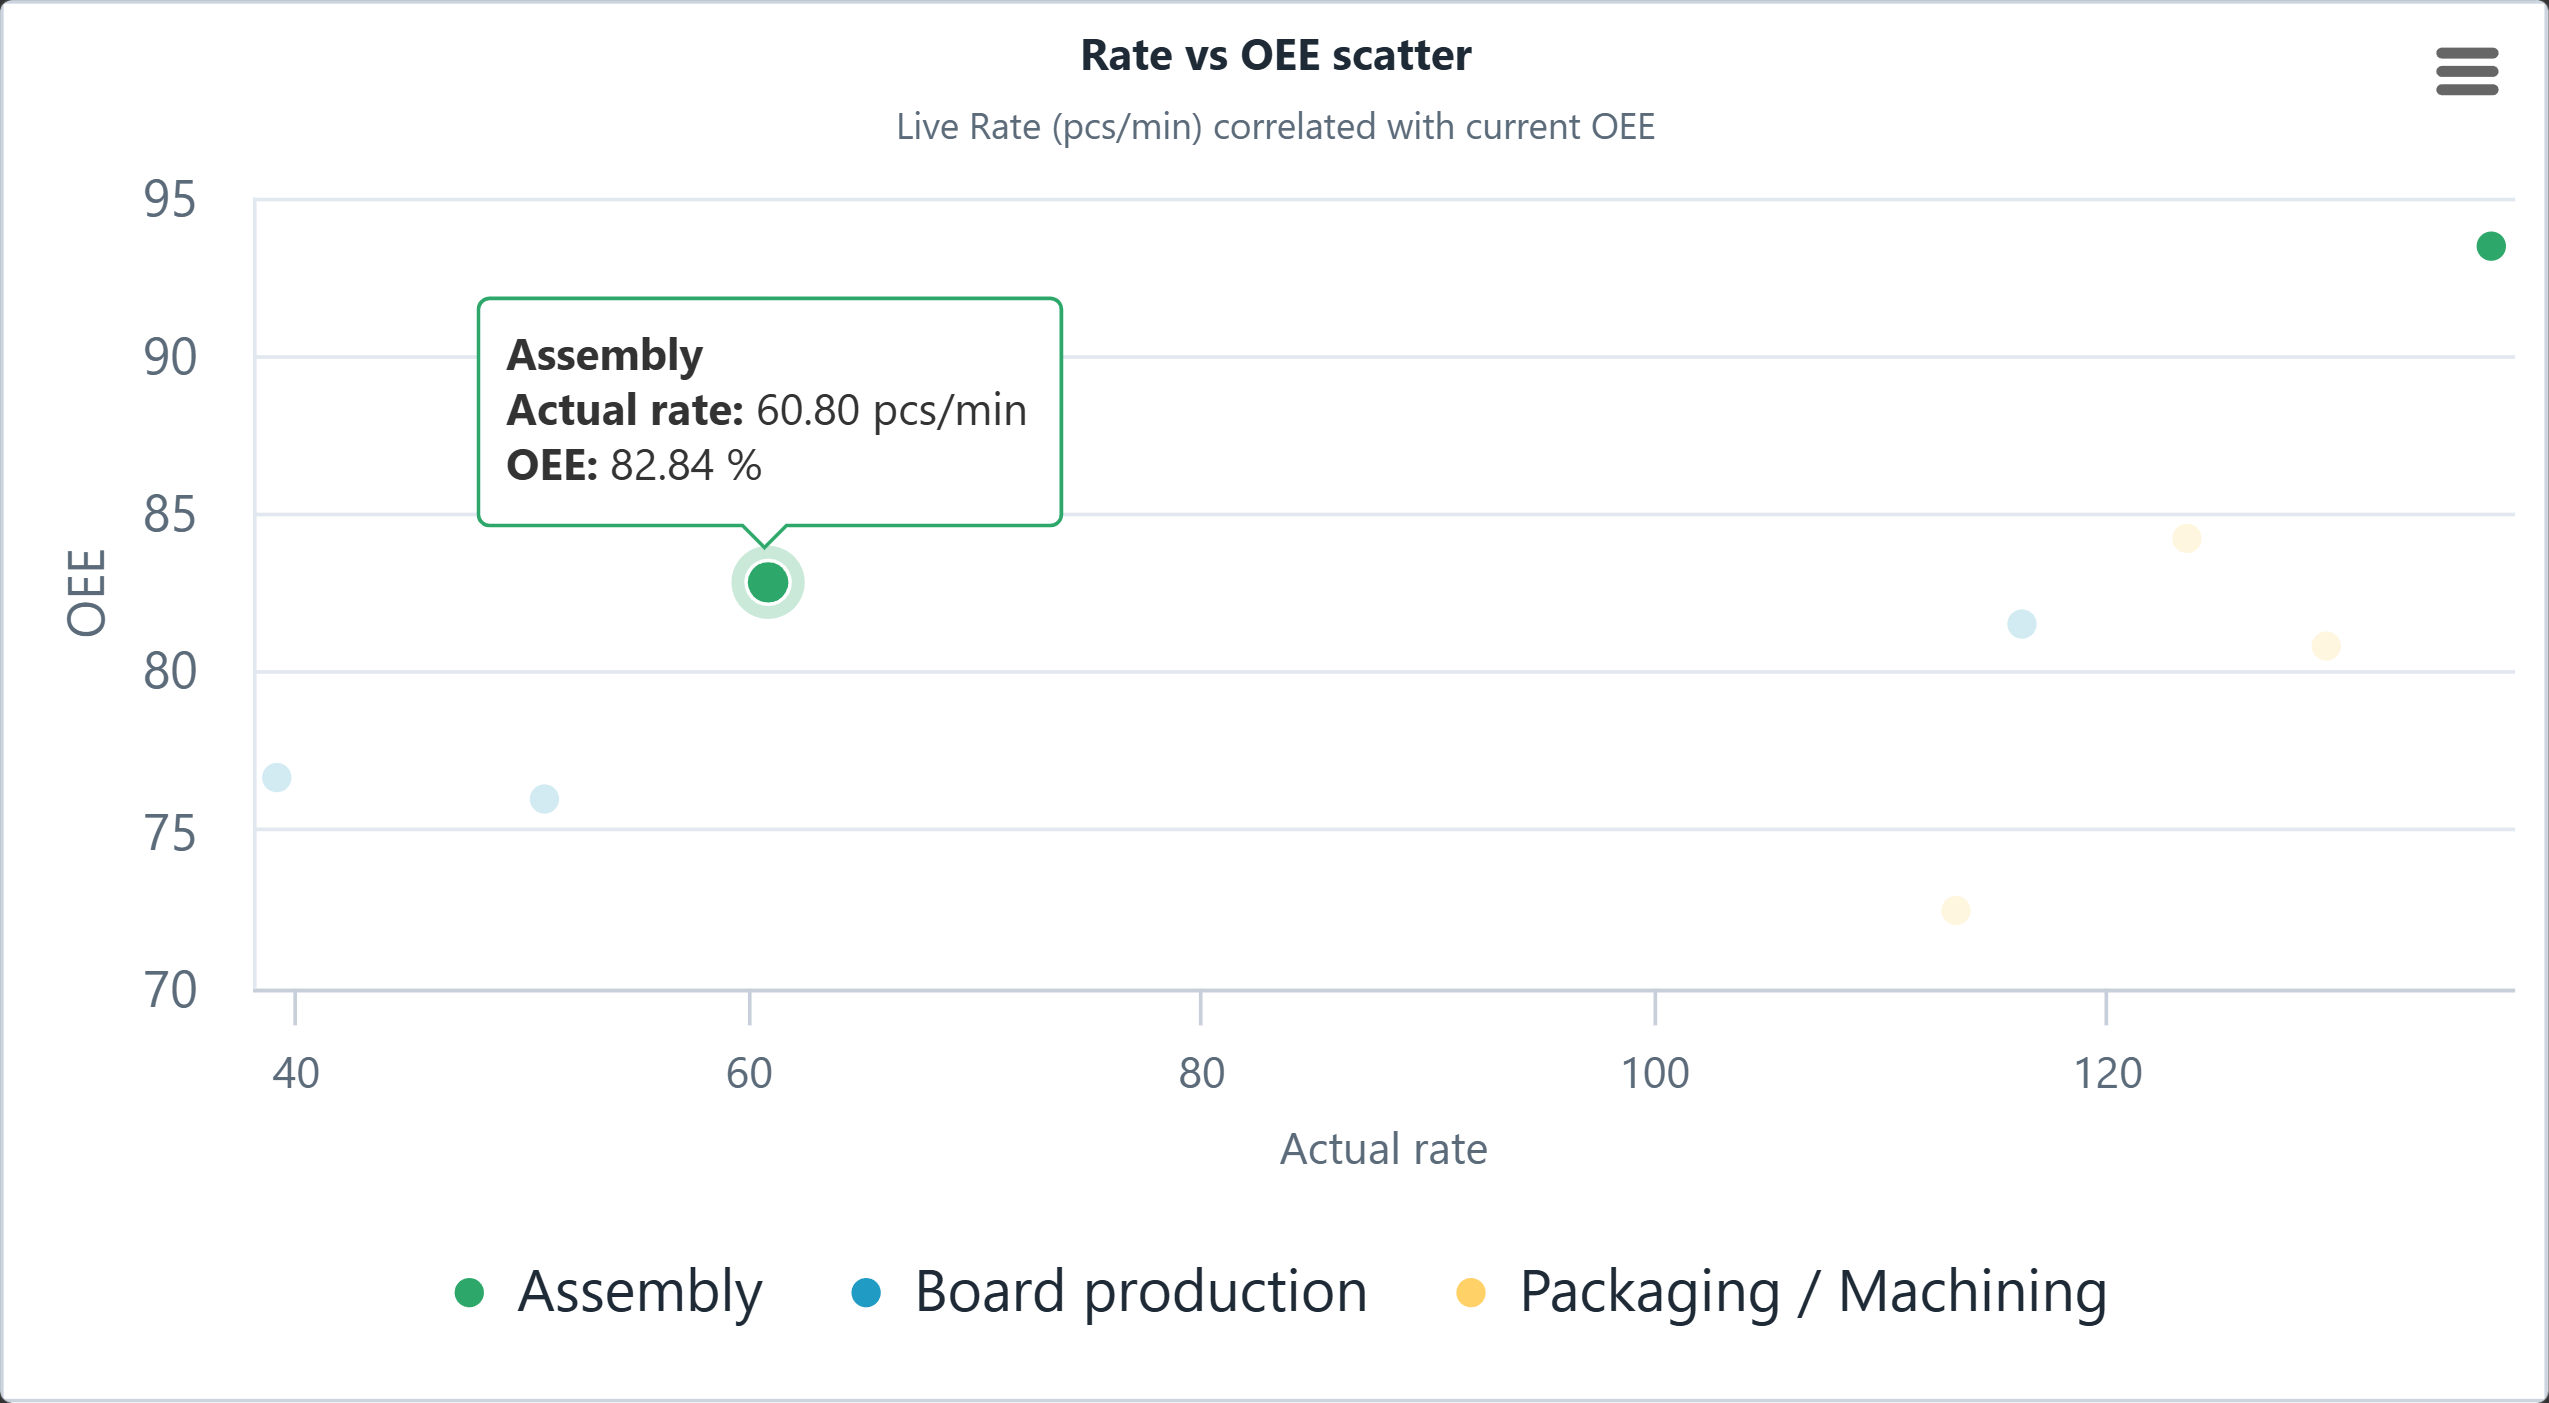
Each point in the chart represents one data item. The horizontal axis defines the X value, while the vertical axis defines the Y value. This makes the component suitable for comparing process values, performance indicators, measurements, or dataset-based information.
Property | Description | ||
|---|---|---|---|
Style | Data Labels | Enabled | If enabled, the specific value of every data point is displayed on the chart. |
Font Size | Character size of data labels on the chart in pixels. | ||
Font Family | Defines typeface for data labels using CSS font-family of data labels on the chart . | ||
Color | Defines the color of the data labels on the chart. | ||
ScatterChart | Series | Dataset | Series in scatter charts match pairs of values in a single point of the chart, making conventional datasets to pair values on the list with their timestamp on each point. To represent two different values on each point, datasets must have the structure dataset([[x1,y1], [x2,y2], ..., [xn,yn]]), where each x and y represents individual values of the list of values to be represented, matched on pairs following the criterial required on the chart. Derived tags are suggested to simplify the generation of the dataset. |
Shared Y Axis | Jitter Y | Specifies the amount of vertical random dispersion applied to data points when sharing Y-axis. | |
Heatmap
Heatmaps display data in a graphical format, representing values through colors on a grid. It's used to visualize and analyze data patterns, especially in large datasets. Heatmaps offer an intuitive way to identify trends, correlations, and outliers within the data by providing a visual representation of data density or intensity across different categories or dimensions. Heatmaps offer the following configuration properties:
Note:
Starting from N3uron version 1.21.7, the Heatmap component is introduced.
Style
Style | Description | |
|---|---|---|
Legend | Show | Show/hide legend. |
Align | Options for alignment of the legend; Bottom, Right and Left. | |
Color | Low color | The color assigned to the lowest value and will interpolate up to the color in High color. |
High color | The color assigned to the highest value and will interpolate down to the color in Low color. | |
Low value | The lowest value assigned to the Low color. Set empty to calculate it automatically based on the series data. | |
High value | The highest value assigned to the High color. Set empty to calculate it automatically based on the series data. | |
Series | Tooltip enabled | When enabled the series tooltip is shown in mouse hover. |
Tooltip font size | Text size inside the series tooltip. | |
Border color | Series border color. | |
Border width | Series border width. Zero or empty to hide. | |
Title | Font size | Title font size in pixels. |
Color | Title font color. | |
Subtitle | Font size | Subtitle font size in pixels. |
Color | Subtitle font color. | |
Style | Description | |
|---|---|---|
X axis | Line color | Separator line between x axis labels and series area color. |
Line width | Separator line between x axis labels and series area width. | |
Tick spacing | Horizontal axis spacing between label ticks. Only applies to datetime types without a label alias | |
Force tick start | When True, a tick is forced at the start of the X axis. | |
Force tick end | When True, a tick is forced at the end of the X axis. | |
Title font size | Text size in pixels of X axis title. | |
Labels font size | Text size in pixels of X axis labels. | |
Text color | Text color of X axis title and labels. | |
Y axis | Title font size | Text size in pixels of X axis title. |
Labels font size | Text size in pixels of X axis labels. | |
Axis line width | Width of vertical gris lines. Input 0 to hide. | |
Axis line color | Color of vertical grid lines. | |
Heatmap
Property | Description | ||
|---|---|---|---|
Title | Actual text of the Heatmap's title. | ||
Subtitle | Actual text of the Heatmap's subtitle. | ||
X axis | Title | X axis title. | |
Text alias | Text alias allows users to display labels instead of values. The data values will be converted to the corresponding labels. There are 3 ways to define the label list:
| ||
Minimum | Sets the minimum value of the X axis, hiding smaller values. This option will only apply in case the X axis is of type Datetime or Text alias field is empty. <null> or empty for automatic limit. | ||
Maximum | Sets the maximum value of the X axis, hiding smaller values. This option will only apply in case the X axis is of type Datetime or Text alias field is empty. <null> or empty for automatic limit. | ||
yAxis | Title | Y axis title | |
Text alias | Text alias allows users to display labels instead of values. The data values will be converted to the corresponding labels. There are 3 ways to define the label list:
| ||
Series | Active | Active or deactivate the series. | |
Label | Text for the series label. | ||
Dataset | Data loaded for this series. | ||
Events | Click | Event triggered when this series in clicked over the chart plot area. | |
Datasets
The Heatmap component allows access to a list of datasets, which can be added without limitation to this section.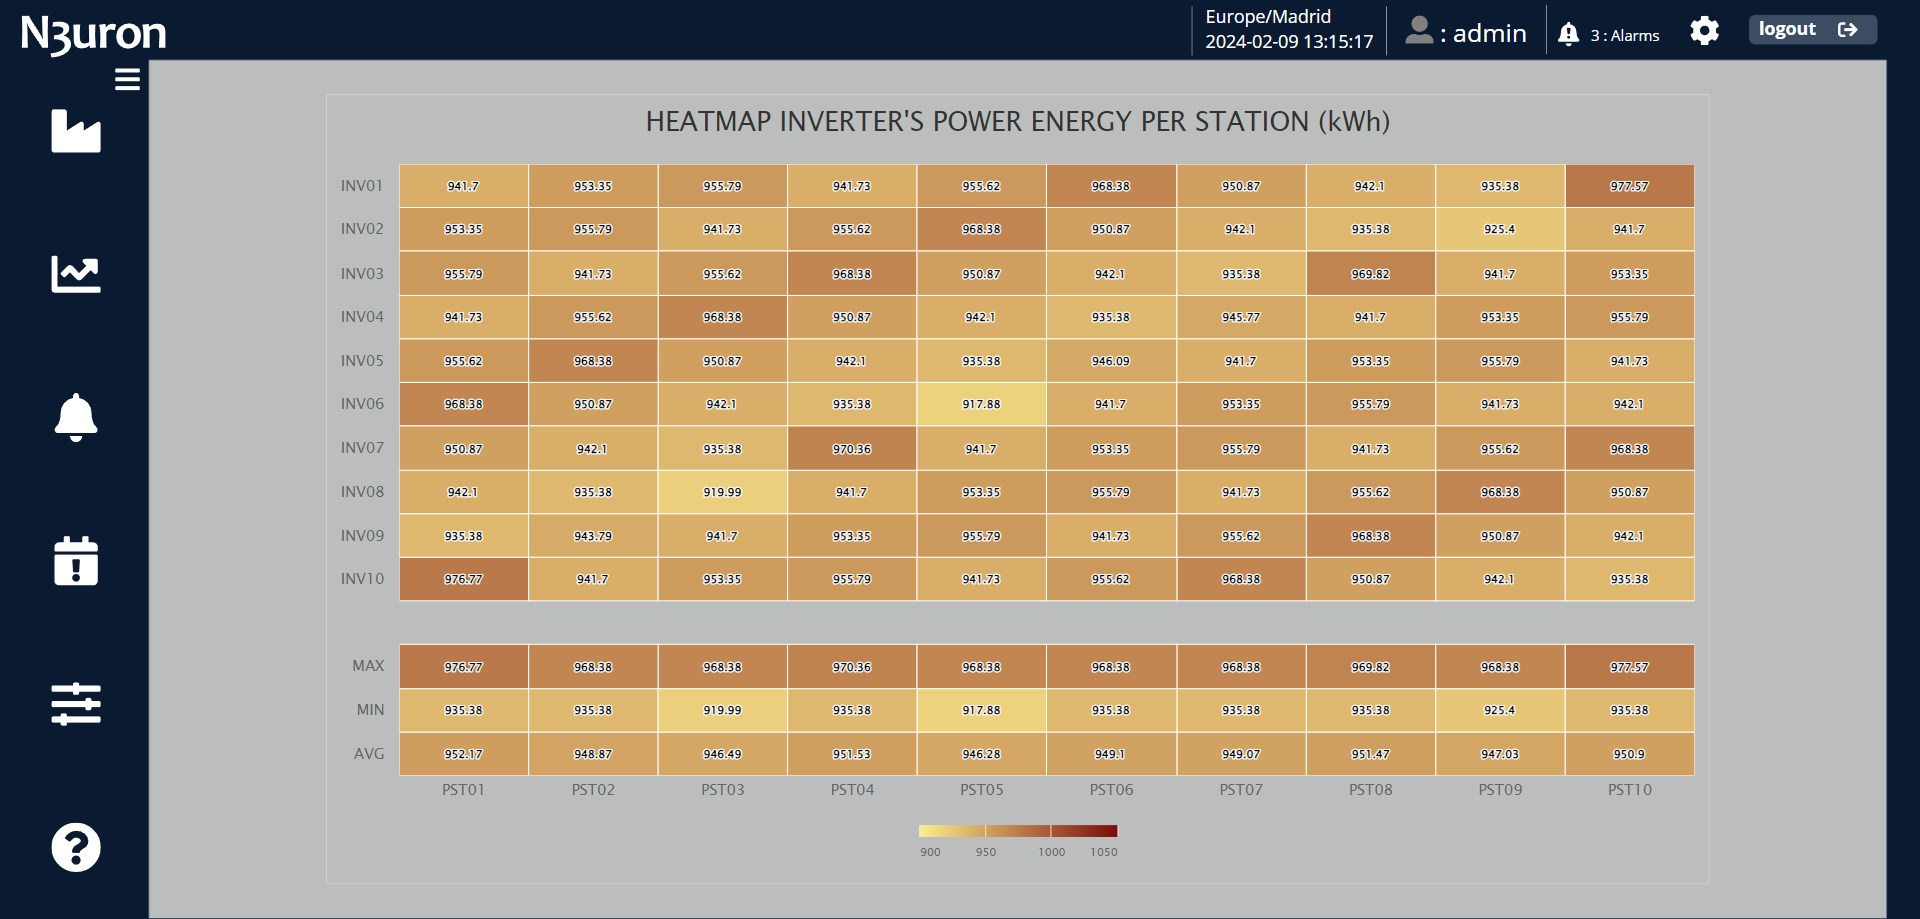
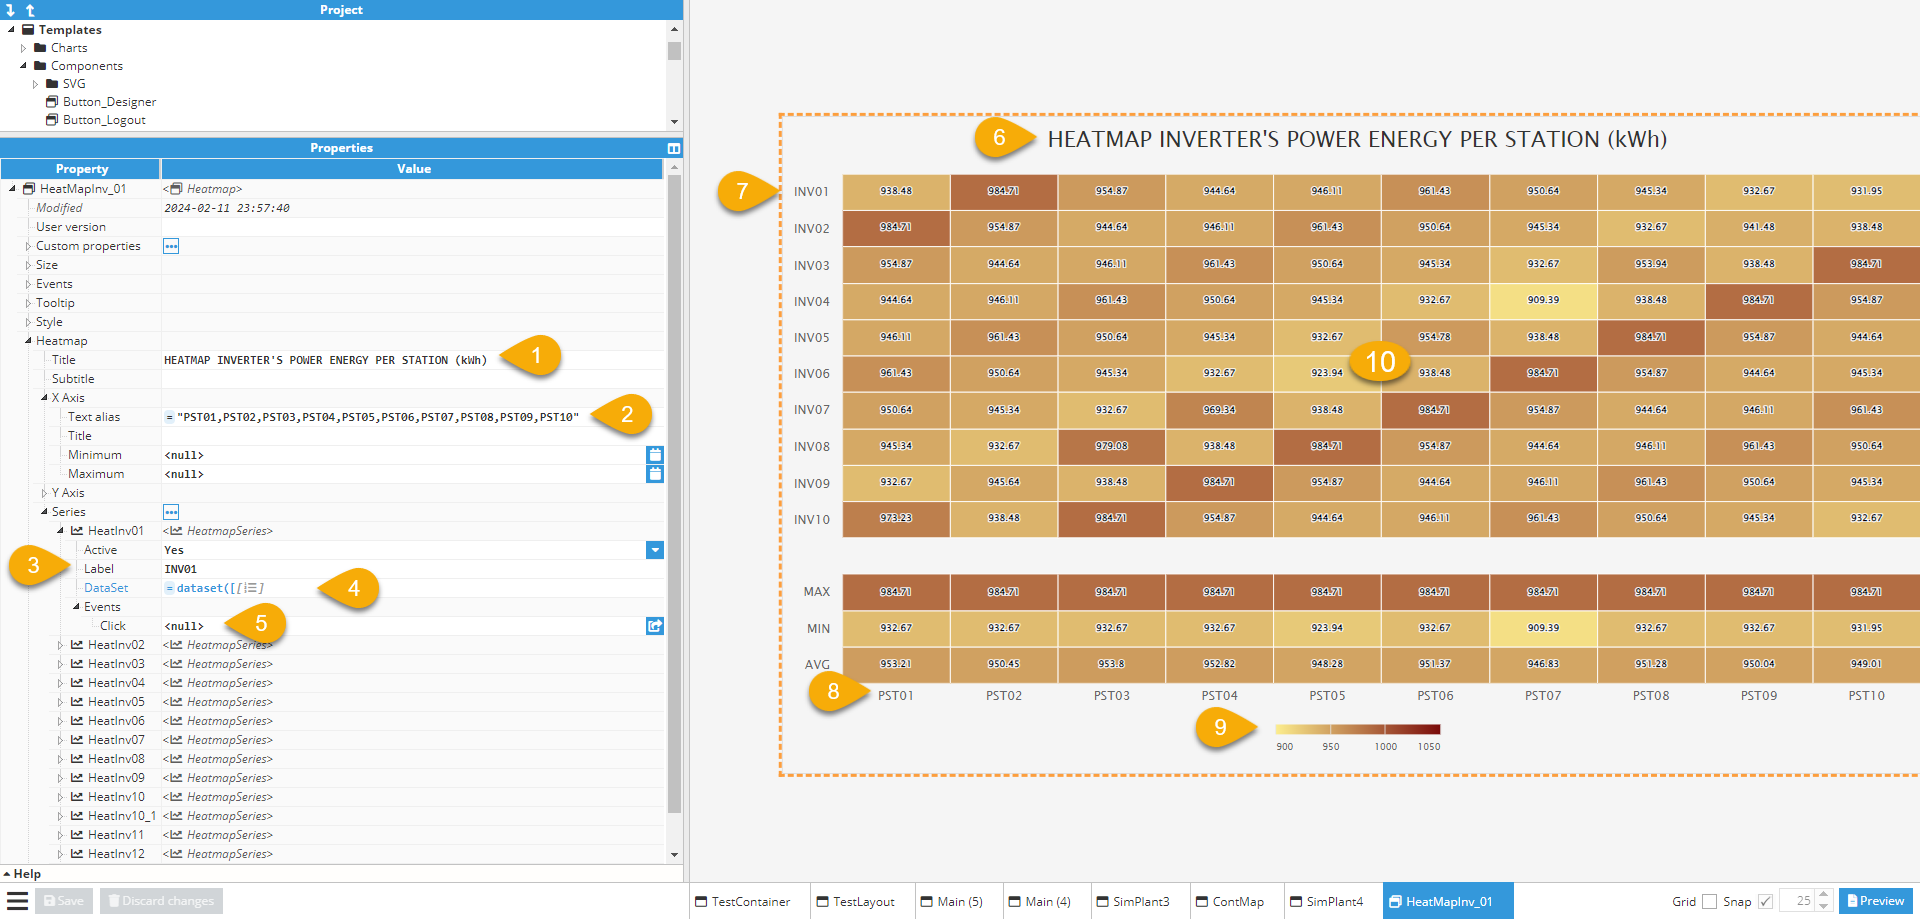
Heatmap's title.
Text alias for the X axis.
Label of the series.
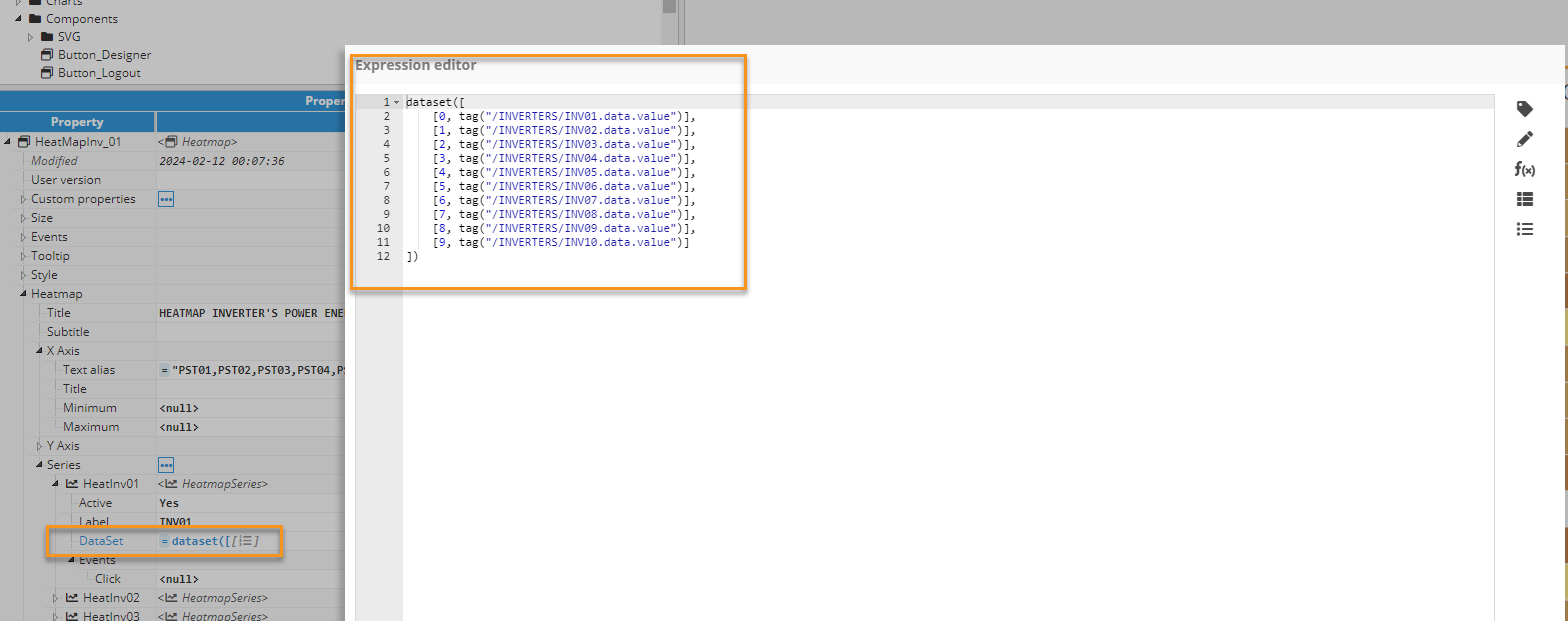
For the dataset of the series, consider the image below, illustrating the first series in this example.
Field to specify the action event triggered when the series is clicked in the Heatmap's series. In this example, this feature is not utilized.
Heatmap title displayed in the visualization area.
Series labels displayed in the visualization area.
X-axis text aliases displayed in the visualization area.
Legend displayed in the visualization area.
Heatmap values with their corresponding interpolated color displayed in the visualization area.
Datetime picker
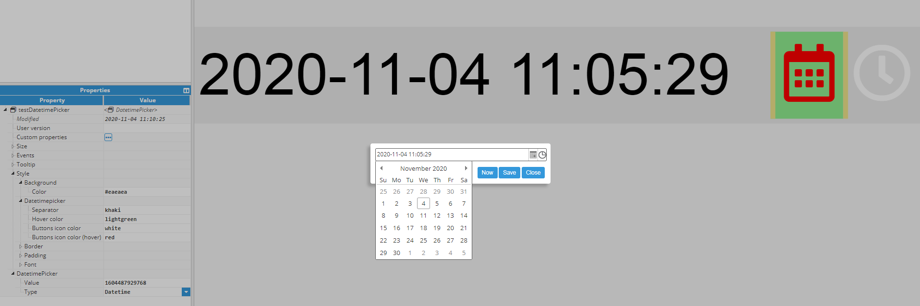
Datetime Picker uses a calendar to select the date and time. Once clicked, a popup will open with a date and time selector available as helpers. The Datetime Picker section contains specific configuration for this component:
Property | Description | |
|---|---|---|
Style | Separator | Color of the separator between the calendar and clock buttons. |
Hover color | Color of the separator between the calendar and clock buttons. | |
Buttons icon color | Color of the separator between the calendar and clock buttons. | |
Buttons icon color (hover) | Calendar button icon color when hovering. | |
DatetimePicker | Value | Displays selected time in epoch format using milliseconds. This format makes this value easier to use in other calculations. |
Type | Text size in pixels of X axis title. | |
Datetime | Select date and time. | |
Date | Select date only. | |
Time | Select time only. | |
Dropdown
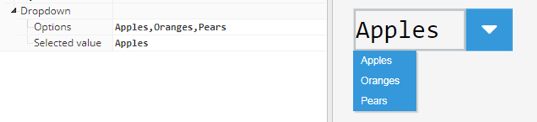
A dropdown component is used to create a list of choices, where only one can be selected at a time. The specific options for this component are listed in the Dropdown section:
Property | Description |
|---|---|
Options | Comma-separated list with all required options. For instance, Apples, Oranges, Pears. |
Selected value | Contains the current selected value. Automatically updates anytime the user chooses a value from the dropdown. If this value is already written, the new value assigned will also be shown in the dropdown as the selected value. |
Ellipse
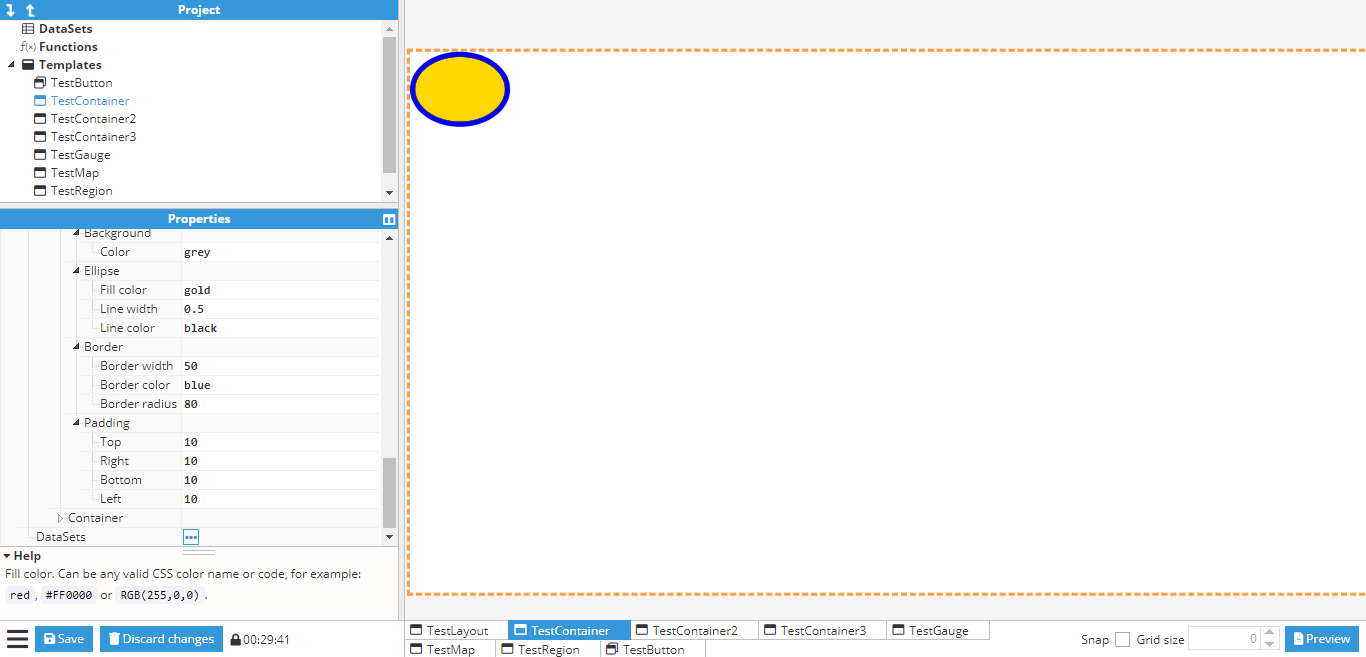
An ellipse component is used to draw a generic ellipse or a circle, providing that the width and height are equal. There is an Ellipse subsection inside the Style section, which includes the following specific properties:
Property | Description |
|---|---|
Fill color | Color of the area inside the ellipse. |
Line width | Width of the ellipse outline, in pixels. |
Line color | Color of the ellipse outline. |
Gauge
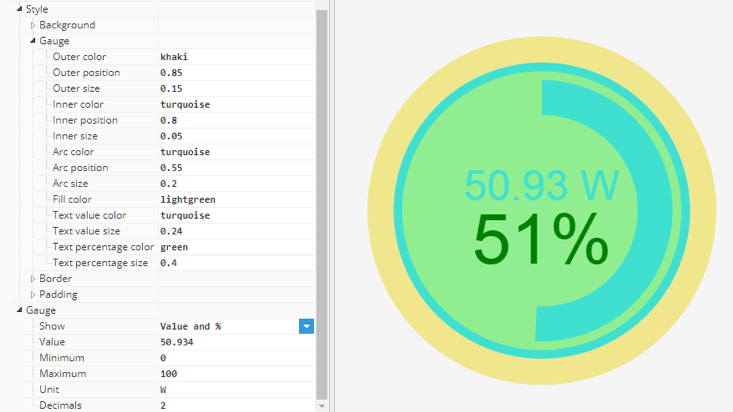
A gauge is a visual component that can be used to show the value of a numeric tag. Gauge has multiple configuration properties:
Style
Property | Description |
|---|---|
Outer color | Outer circle color. |
Outer position | Outer circle position as a percentage of the radius, from 0 to 1. |
Outer size | Outer circle size as a percentage of the radius, from 0 to 1. |
Inner color | Inner circle color. |
Inner position | Inner circle position as a percentage of the radius, from 0 to 1. |
Inner size | Inner circle size as a percentage of the radius, from 0 to 1. |
Arc color | Arc color. |
Arc position | Arc position as a percentage of the radius, from 0 to 1. |
Arc size | Arc size as a percentage of the radius, from 0 to 1. |
Fill color | Fill (interior) color. |
Text value color | Upper value text color. |
Text value size | Upper value text size relative to the radius. |
Text percentage color | Lower percentage text color. |
Text percentage size | Lower percentage text size relative to the radius. |
Gauge
Property | Description |
|---|---|
Show | Determines whether the gauge displays the value, the percentage, or both. |
Value | Current gauge value, represented visually by the gauge arc. |
Minimum | Minimum value of the permitted range. Values below this limit result in a negative percentage. |
Maximum | Maximum value of the permitted range. Values above this limit result in a percentage greater than 100%. |
Unit | Unit displayed alongside the gauge value. |
Decimals | Number of decimal places displayed. If the value has fewer decimal places than specified, trailing zeros are added automatically. |
Icon
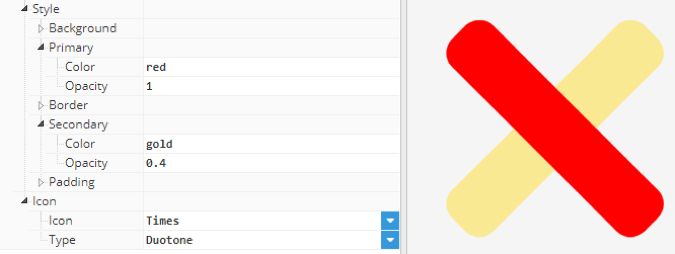
The icon component inserts any of the 1850 icons from Font Awesome 5.13.0 (except brand icons). The list of available icons can be found at FontAwesome. The color of the icon can be configured in the Styles section, while the specific configuration for this component can be found in the Icon section:
Property | Description | ||
|---|---|---|---|
Icon | Name of the icon, as per Font Awesome. The drop-down contains just a few example icons but the name of any other icon from Font Awesome version 5.13.0 can also be used. | ||
Type | Allows users to choose from four icons in different styles (solid, regular, light and duotone). If duotone is selected, new options will be available in the style properties group. Duotone is also available for all elements with configurable icons, such as Tree. | ||
Primary | Primary component style configuration. | ||
Color | Primary color. | ||
Opacity | Primary opacity. | ||
Secondary | Secondary component style configuration. | ||
Color | Secondary color. | ||
Opacity | Secondary opacity. | ||
Image
This component inserts images onto the screen. Supported image formats are .jpg, .png, .svg and gif.
Input
An input component is a text box in which the user can enter a value. When using events associated to this component, the inserted value can be written to a tag or used to change a property in another component.
Label
This component can display any text or value. In this way, its value can be linked to a tag to display any of its properties, such as value, quality, or timestamp.
Line
This component inserts lines onto the screen. The line is defined by the coordinates of the start and end point. Each coordinate is relative to the line container and can be expressed in pixels or as a percentage of the container.
Pie chart
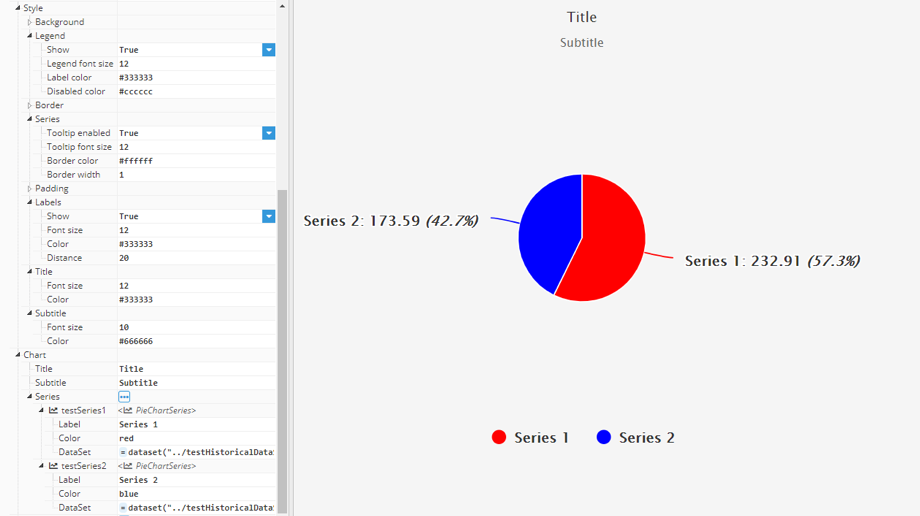
Pie chart displays data as a circular chart divided into different sections, each representing a series, much like the Chart series. The value of these sections is the sum of the total values in the dataset that has been configured in the corresponding series dataset field. Pie charts include the following properties.
Style | Description | ||
|---|---|---|---|
Legend | Show | Show/hide legend. | |
Legend font size | Legend text size in pixels. | ||
Label color | Legend labels text color. | ||
Disabled color | Legend labels text color for disabled series. | ||
Series | Tooltip enabled | Enable/disable tooltip when hovering. | |
Tooltip font size | Text size for tooltip. | ||
Border color | Series border color. | ||
Border width | Series border width. | ||
Labels | Data labels are labels that are attached to every chart sector to display the series name and value. | ||
Show | Show/hide labels. | ||
Font size | Labels text size in pixels. | ||
Color | Labels text color. | ||
Distance | Distance between the chart labels and border. Negative values can be used to place the label inside the chart. | ||
Title | Font size | Title text size in pixels. | |
Color | Title text color. | ||
Subtitle | Font size | Subtitle text size in pixels. | |
Color | Subtitle text color. | ||
Chart | Title | Title displayed as text. | |
Subtitle | Subtitle displayed as text. | ||
A Series contains the data represented in each pie chart section. It includes the following configuration properties.
Property | Description |
|---|---|
Label | Series name displayed on the data labels, tooltip and legend. |
Color | Series color. |
Dataset | Series data in dataset format. |
Note:
Starting from N3uron version 1.21.7, flexible column ordering has been implemented for the Realtime Table and Sublevels configuration option, allowing inclusion of tags within child groups.
Realtime table
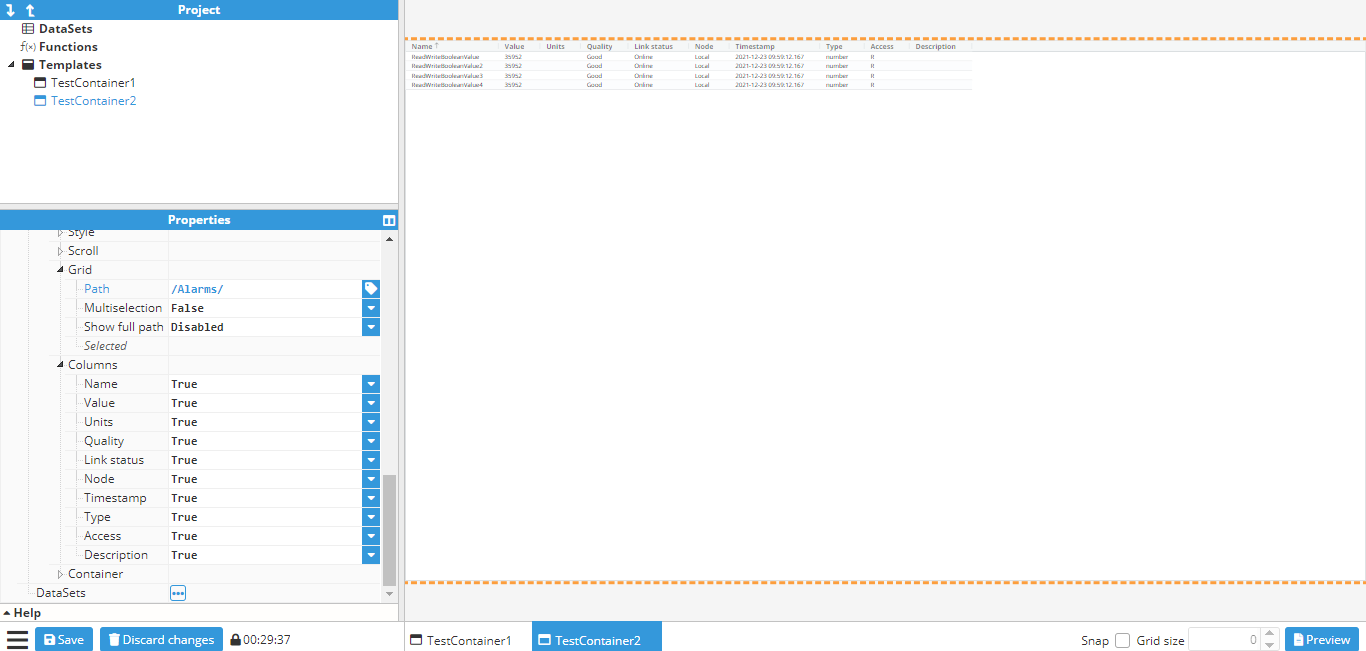
This component inserts a table containing the current values from multiple tag properties and shares all the same styles as the Alarm table component. It includes the following specific configuration properties:
Property | Description |
|---|---|
Path | Path to the tag group whose tags will be included in the table. Tags in child groups are excluded unless Sublevels is enabled. |
Path Filter | Regular expression used to filter tags by their full path. |
Sublevels | When enabled, includes tags located in child groups of the selected path. |
Multiselection | Enables the selection of multiple rows. |
Show full path | When enabled, displays the full tag path instead of only the tag name. |
Selected | Contains the paths of the currently selected rows as a comma-separated list. |
Columns | Contains the list of the available information to be shown by each of the tags inside the table and its status:
|
As for Alarm tables, the Realtime table also includes a columns properties group, which allows users to show/hide individual columns.
Realtime tag
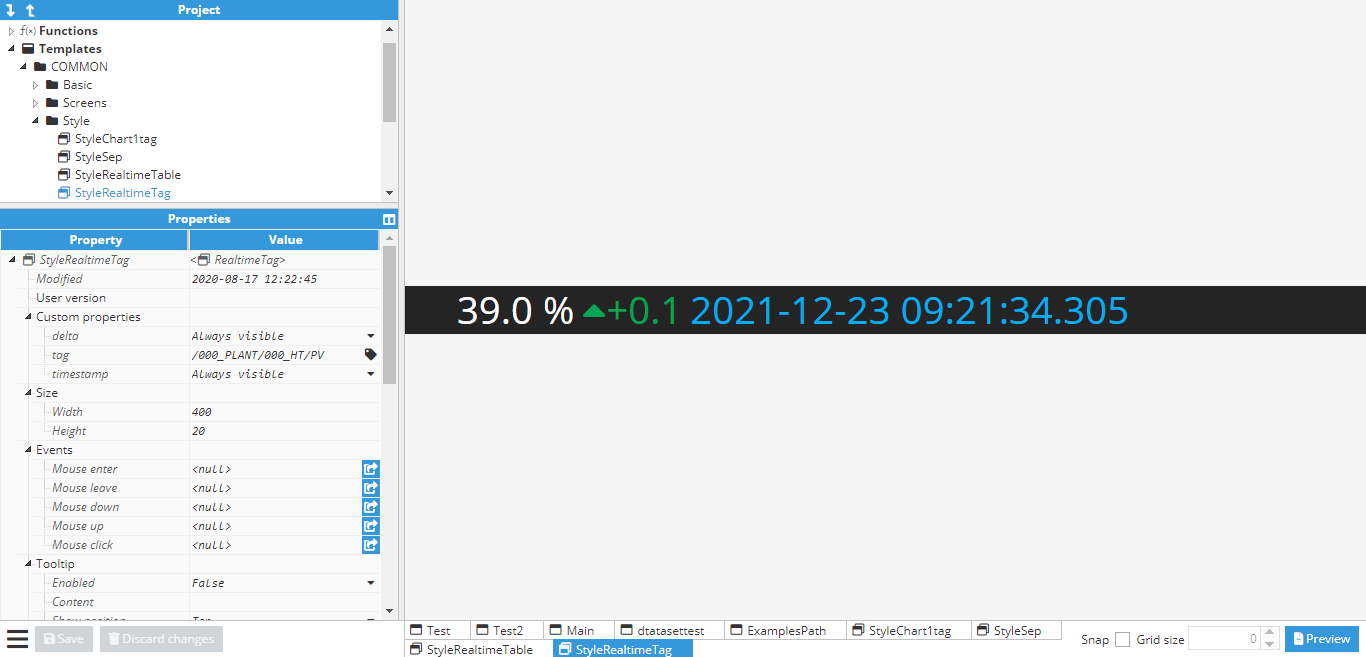
This component is an easy way to show the value of a tag alongside its timestamp and delta indicator. It has the following configuration properties.
Property | Description | ||
|---|---|---|---|
Styles | Delta color increment | Color for the delta, when positive. | |
Delta color decrement | Color for the delta, when negative. | ||
Timestamp color | Timestamp color. | ||
Error color | Color of error messages. | ||
Tag | Path | Refers to the path of the tag. | |
Delta timeout | Time the delta value is displayed for after each change, in milliseconds (“null” or empty to hide, 0 to remain permanently visible). | ||
Timestamp timeout | Time the timestamp value is displayed for after each change, in milliseconds (“null” or empty to hide. 0 to remain always visible). | ||
Timestamp position | Enables the user to select the timestamp position. | ||
Top | On top of the value. | ||
Bottom | Below the value. | ||
Left | To the left of the value. | ||
Right | To the right of the delta. | ||
Middle | Between the value and delta. | ||
Rectangle
This component allows users to draw a rectangle or a square, providing that the width and height are equal. Rectangle allows the color and width of each side to be configured independently. Color can be configured inside the style properties group and width under the Rectangle properties group.
SVG
This is a powerful component that inserts any Scalable Vector Graphics (SVG) image onto the screen. This format is very convenient since it gradually resizes while maintaining quality. There are also many SVG graphics available online to avoid users having to create them from scratch.
To import an SVG into the project, users can copy the graphic code in the SVG section, or, it can be uploaded as a file using the expression editor helper.
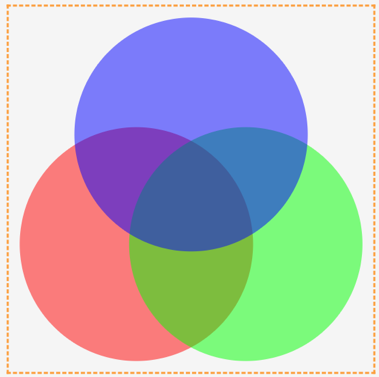
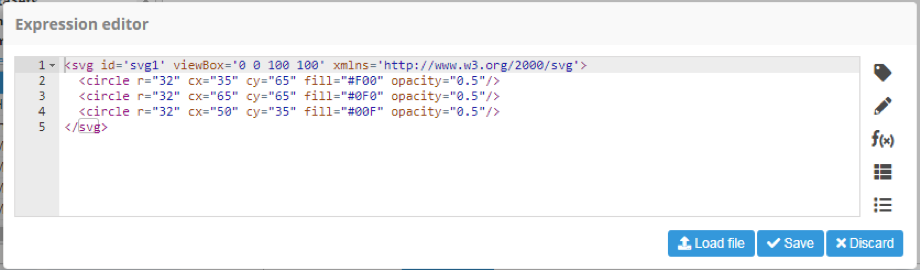
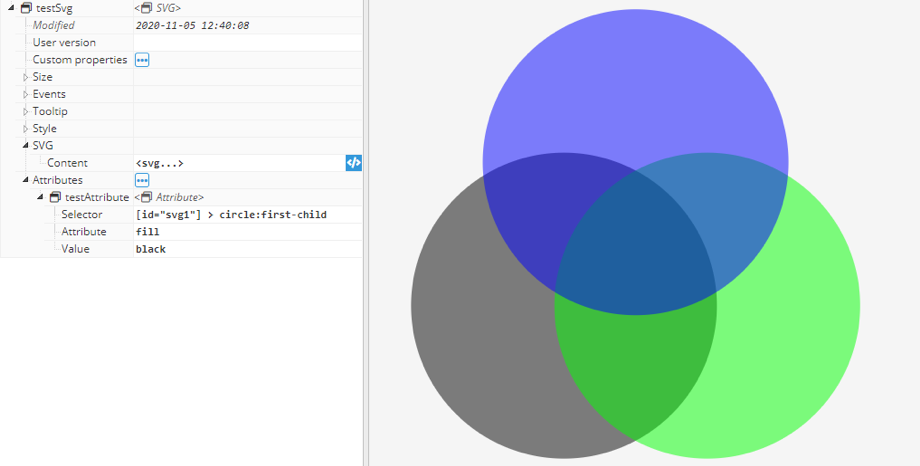
Once the SVG has been imported, the value of any attribute in the Attributes section can be changed.
Property | Description |
|---|---|
Selector | Selects the element within the SVG using the CSS selector syntax. |
Attribute | Specifies the attribute to change. |
Value | Specifies the value for the attribute. |
Sound
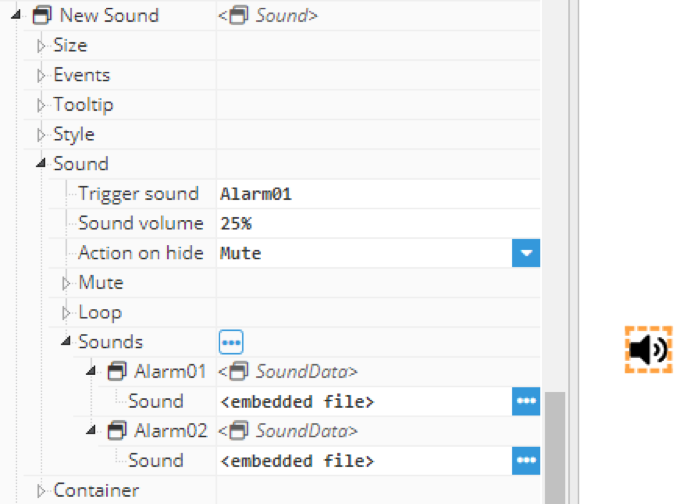
The Sound component enables audio playback in the client’s web browser. Each Sound component has one or more sound clips associated with it and plays that clip-on demand. There is a built-in triggering system, as well as specific facilities for looping the sound while the trigger is set. The sound clip can be any .mp3 or .m4a file. The clip will be embedded within the container where the sound player is located. Clients do not need access to a shared sound file. It includes the following properties:
Property | Description | |
|---|---|---|
Trigger sound | Triggers playback when the value matches the name of a clip configured under Sounds. | |
Sound volume | Sets the playback volume, from 0% to 100%. | |
Action on hide | Defines how playback behaves when the screen or container containing the component is hidden. | |
Mute | Playback continues while the component is hidden, but its audio is muted. Audio becomes audible again when the component is shown. | |
Play | Playback continues normally while the component is hidden. | |
Pause | Playback pauses when the component is hidden and resumes from the same position when it is shown again. | |
Restart | Playback stops when the component is hidden and restarts from the beginning when it is shown again. | |
Mute | Contains the options used to control whether playback is muted and how users can change its mute state. | |
Mute | When enabled, the sound is muted during playback. | |
Unmute on trigger | When enabled, Mute is reset to False whenever a new sound is triggered by a change in Trigger sound. | |
Toggle mute on click | When enabled, users can click the sound icon to toggle between muted and unmuted playback. | |
Loop | Contains the options that control repeated playback of the selected sound. | |
Loop count | Sets the number of times the sound is played after it is triggered. Set the value to 0 for continuous playback. | |
Loop delay | Sets the delay, in milliseconds, between consecutive playbacks. | |
Sounds | Defines the sound clips available to the component. A clip is played when its name matches the current Trigger sound value. Supported file formats include .mp3 and .m4a. | |
Note:
Sound files are loaded when their containing screen or container is loaded for the first time. A sound cannot be played until that container has been loaded.
TagPicker
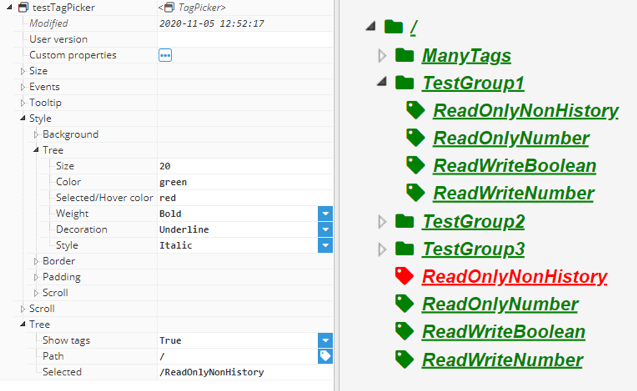
This component allows users to pick a tag from a tree. The tree is the tags hierarchy descendant for the selected tags group. It has the following properties.
Property | Description | |
|---|---|---|
Selector | Size | Tree text and icon size. |
Color | Tree text and icon color. | |
Selected/Hover color | Tree text and icon color when hovered over or selected. | |
Weight | Allows font to be set to bold. | |
Decoration | Allows lines to be | |
Style | Allows lines to be added to text in multiple positions. | |
Selector | Show tags | Allows tags to be shown/hidden. If hidden, only groups will be shown. |
Path | Root path of the Tags to be loaded. | |
Filter | Regex filter. This will apply to the tag model, not to aliases. Note: This feature is available from N3uron version 1.21.5. | |
Selected | Path of the current selected tag/group. If this property is filled with a valid path, the corresponding node will be selected inside the tree. | |
Toggle
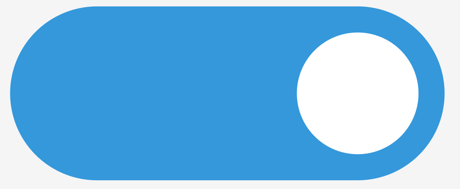
The Toggle component represents a switch with two positions.
Users can choose between different colors for selected and not selected options.
The default color for selected switches is blue and grey when unselected.
It can also be displayed with or without round borders and switches.
The switch state on/off can be accessed using the checked property, inside the toggle group.

Tree
The Tree component defines a hierarchical view of information that can be configured to expand submenu branches and menu items. The sub-items can be expanded further to expose more sub-items if any exist or collapsed to hide sub-items. The typical use of a tree is to allow users to navigate pages within the graphical application. The current path selected can be obtained from the selected property.
The tree is built by recursively adding children. All nodes in the same level are ordered by the instance name. For each child created, the following options are available:
Property | Description | |
|---|---|---|
ChildTree | Contains the properties that define how the corresponding node is displayed and behaves within the tree. | |
Hidden | When enabled, hides the node and all its child nodes from the tree. | |
Label | Defines the text displayed for the node. | |
Icon | Defines the icon displayed next to the node label. This property provides the same icon-selection functionality as the Icon component. | |
Type | Sets the icon style to Solid, Regular, Light, or Duotone. Selecting Duotone displays additional configuration options. | |
Open | Determines whether the node is expanded or collapsed. When the project is saved, this state is restored the next time the tree is loaded. | |
Font style | Color | Sets the default color of the node label and icon. For Duotone icons, colors are configured using the corresponding duotone options. |
Selected/Hover color | Sets the color of the node label and icon when the node is selected or the pointer hovers over it. For Duotone icons, colors are configured using the corresponding duotone options. | |
Weight | Determines whether the node label is displayed in bold. | |
Decoration | Applies a text-decoration line, such as an underline or strikethrough, to the node label. | |
Style | Determines whether the node label is displayed in italics. | |