Another troubleshooting tool provided by WebUI is the File Logs page. This console allows both visualization of log files for one or several modules, as well as downloading of these files. Take a look at Troubleshooting a Module for more information about module Loggers.
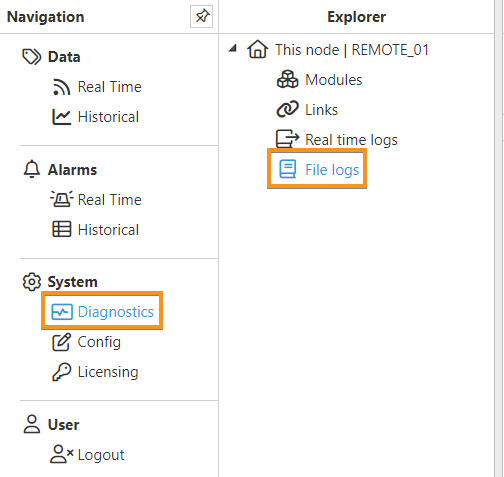
You can find this page by going to System-->Diagnostics and selecting File Logs in the Explorer panel.
Visualizing Real Time Logs
The columns shown in the File logs panel are as follows:
- Timestamp: The timestamp corresponding to the log.
- Level: The Level of the log.
- Module: Module type.
- Name: Module instance name.
- Message: Message for the log.
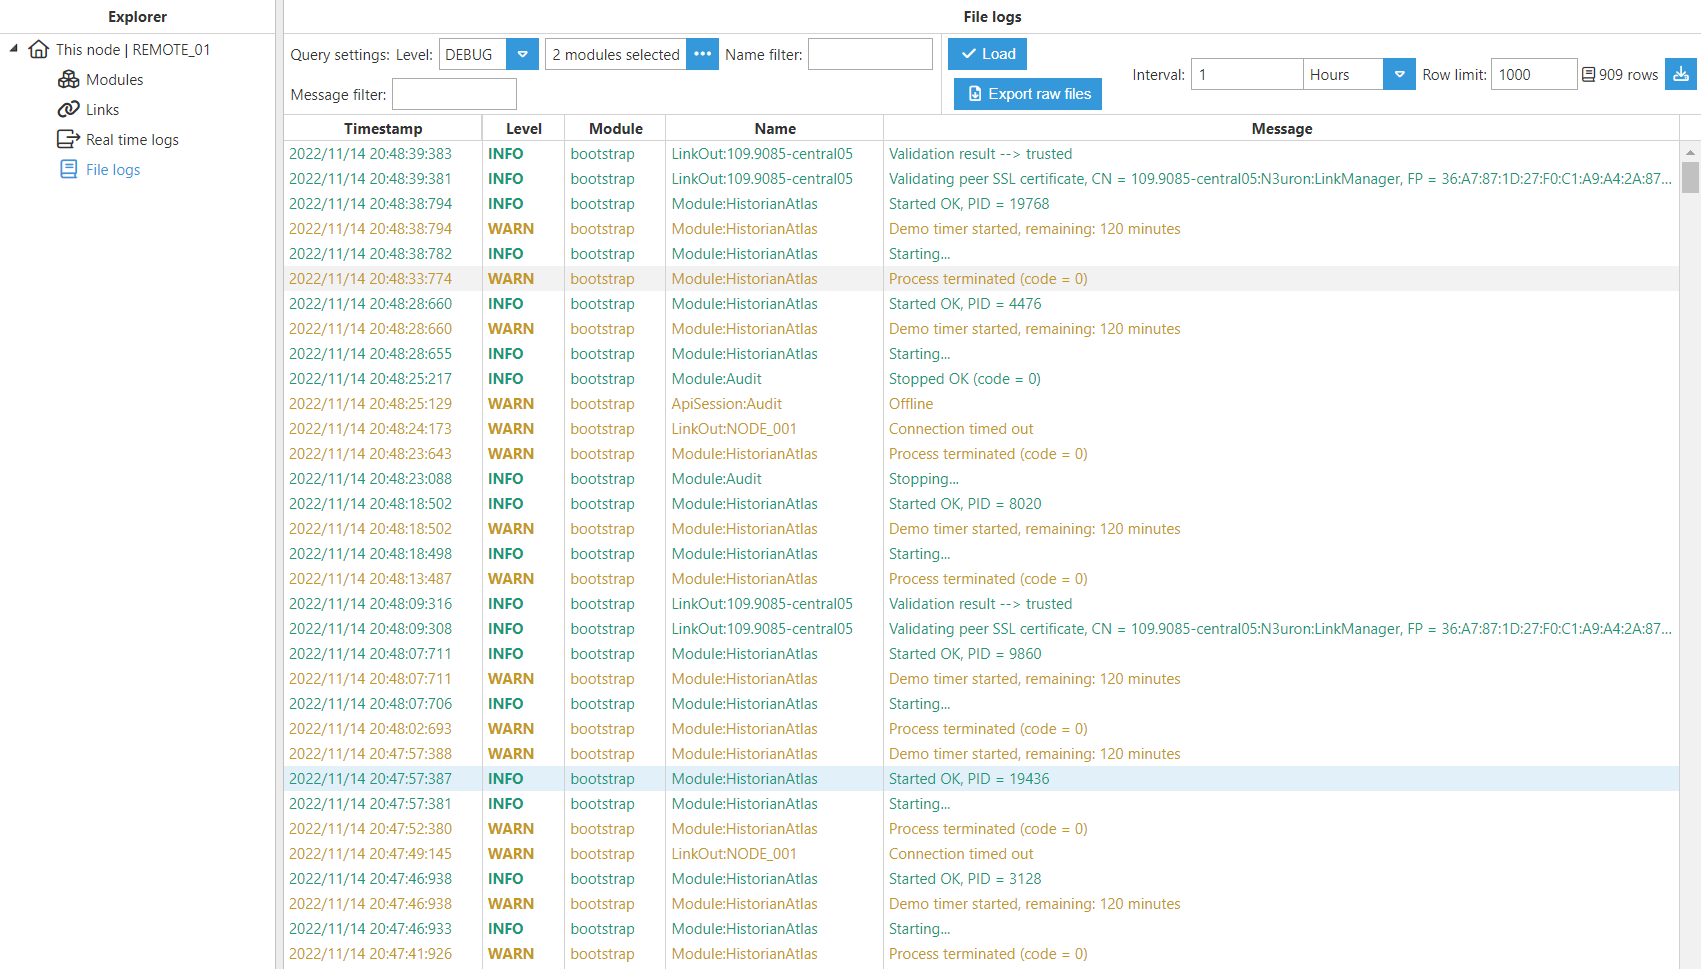
For the File logs panel to start displaying live values, firstly we have to select the module instances from the dropdown menu and then hit the Load button. The maximum level of detail for the logs will be that selected in the dropdown menu, ranging from ERROR, which represents the minimum level of detail, to TRACE.
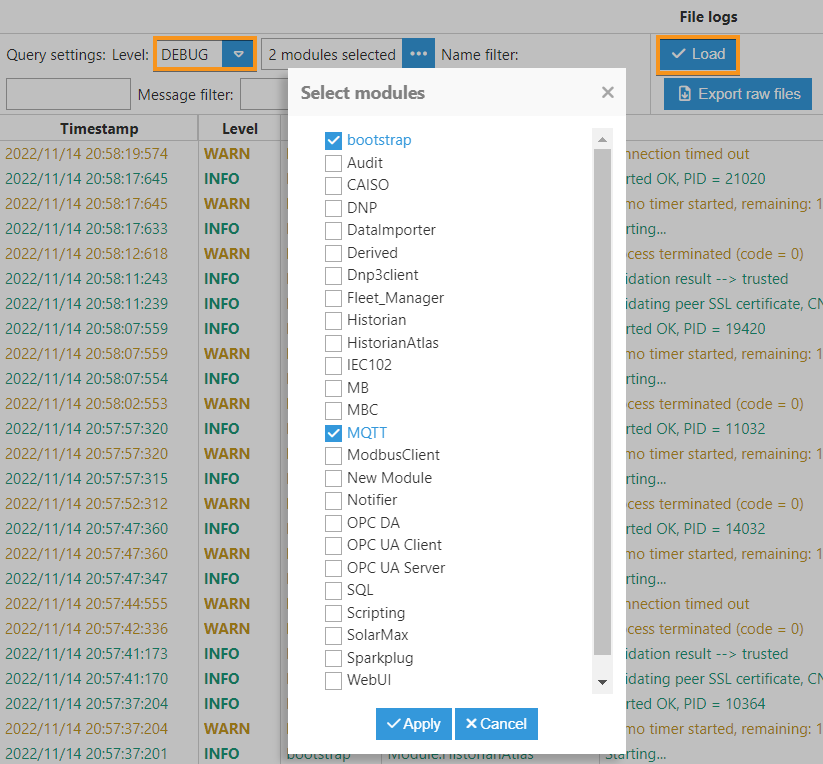
Users can also define and apply some filter criteria using the Name filter, the Message filter, or both. It is also possible to select the Interval for which you want to visualize data.
Node logs can also be exported using the button located in the upper-right corner. Next to this button, there is a rows counter and the Row limit input field, which is intended to restrict the total amount of logs displayed.
.png)
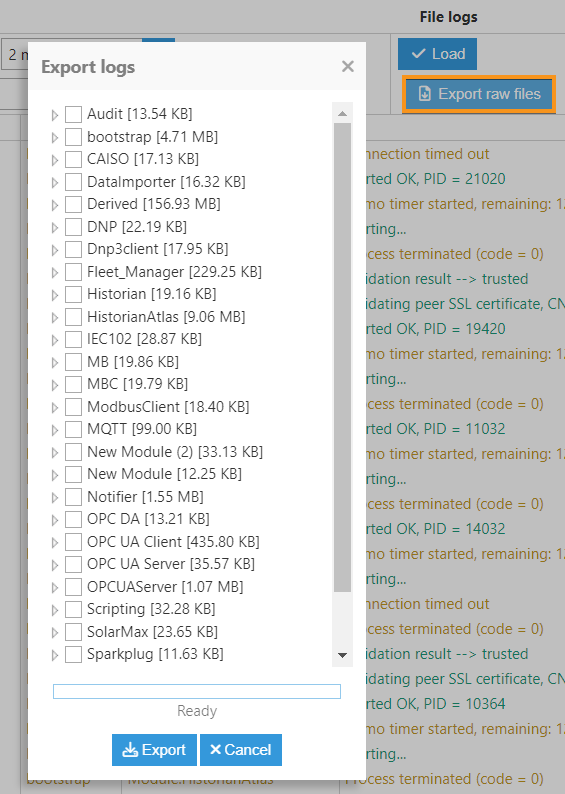
Logs Export
N3uron allows log files to be exported directly from the File Logs panel. To do so, hit the Export raw files button, select the modules you want to obtain information from, click on Export and select the folder you'd like to export the zip file to.